
Introduction
Biostatistics is an essential field that combines statistical methods with biological, medical, and public health research. In today’s data-driven healthcare environment, understanding how to analyze and interpret biological data is crucial. Whether you’re a student, researcher, or healthcare professional, learning biostatistics provides the foundation for evidence-based decision-making.
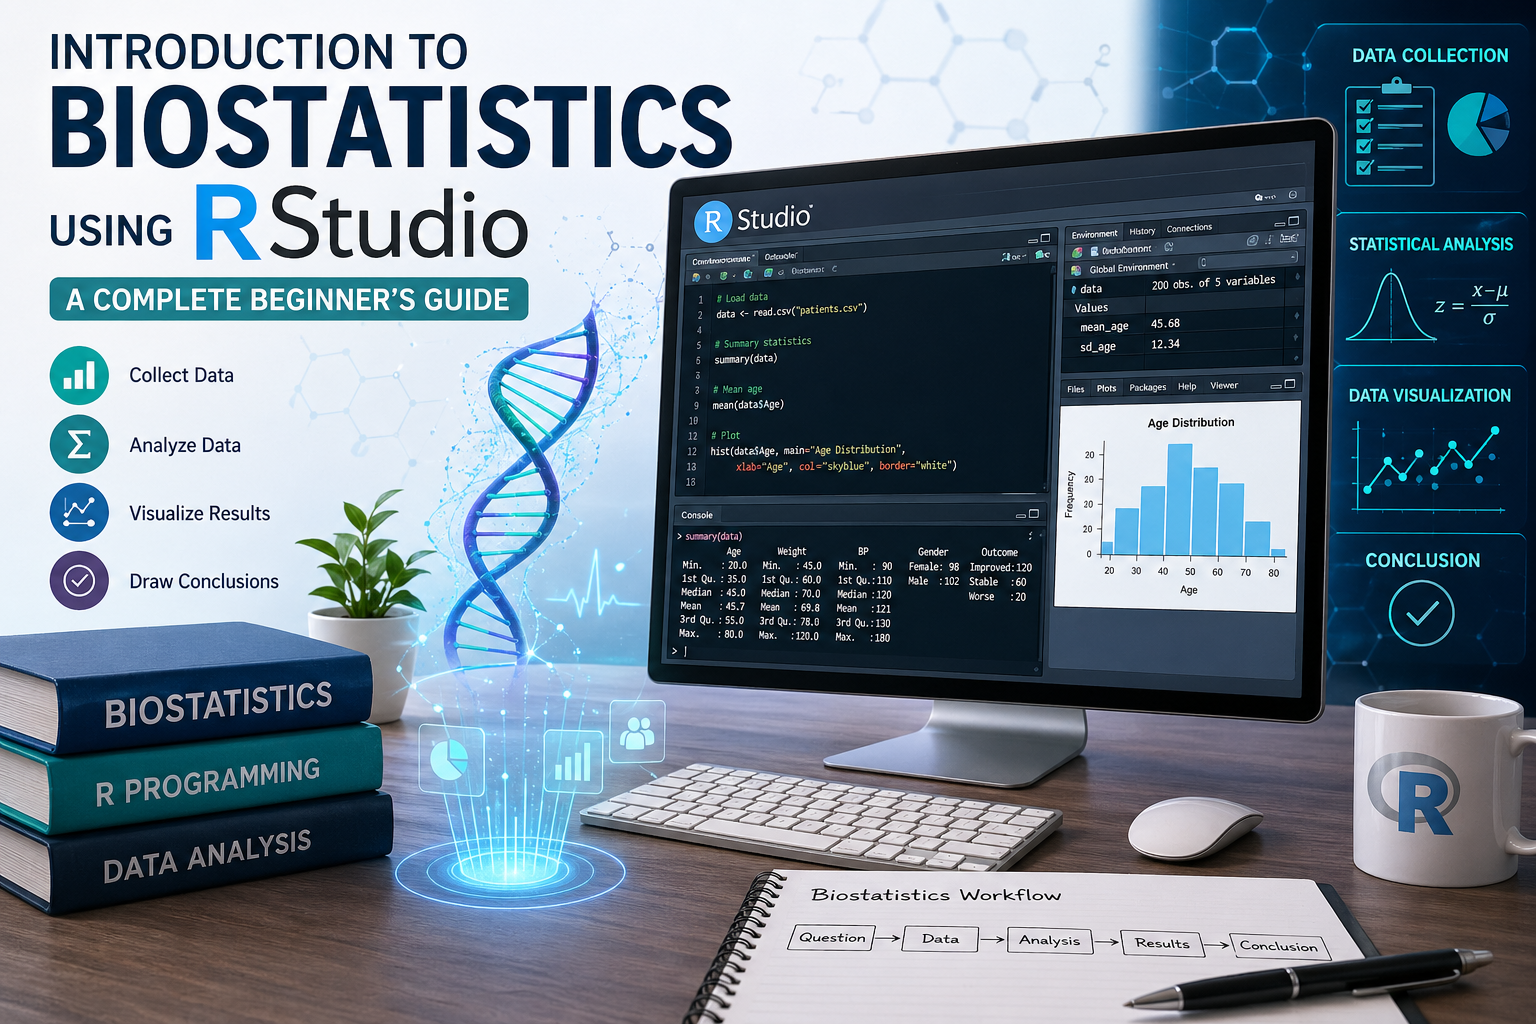
With the rise of powerful analytical tools, RStudio has become one of the most popular platforms for performing statistical analysis. It offers a user-friendly interface for the R programming language, making it ideal for beginners.
This guide will walk you through the basics of biostatistics using RStudio, covering key concepts, practical examples, and step-by-step explanations to help you get started confidently.
What is Biostatistics?
Biostatistics is the application of statistical techniques to biological, medical, and health-related data. It helps researchers:
- Design experiments
- Collect and summarize data
- Analyze results
- Draw meaningful conclusions
Definition
Biostatistics can be defined as:
“The branch of statistics that deals with the analysis and interpretation of data related to living organisms, particularly in healthcare and medicine.”
Why Use RStudio for Biostatistics?
RStudio is widely used because:
- It is free and open-source
- Supports advanced statistical analysis
- Offers data visualization tools
- Has a large community and support
- Integrates easily with packages like
ggplot2,dplyr, andtidyverse
Basic Concepts in Biostatistics
Before diving into RStudio, it’s important to understand the core concepts:
1. Types of Data
- Qualitative (Categorical): Gender, blood group
- Quantitative (Numerical):
- Discrete: Number of patients
- Continuous: Height, weight
2. Population vs Sample
- Population: Entire group under study
- Sample: Subset of the population
3. Variables
- Independent variable (cause)
- Dependent variable (effect)
4. Measures of Central Tendency
- Mean
- Median
- Mode
5. Measures of Dispersion
- Range
- Variance
- Standard deviation
Getting Started with RStudio
Step 1: Install R and RStudio
- Install R from CRAN
- Download and install RStudio
Step 2: Open RStudio Interface
Main sections include:
- Script editor
- Console
- Environment/History
- Plots/Files
Step 3: Basic Commands
# Simple calculation
2 + 3

# Assign value
x <- 10

# Print value
print(x)
Step-by-Step Biostatistical Analysis in RStudio
Step 1: Create a Dataset
# Patient data
patients <- data.frame(
  Age = c(25, 30, 35, 40, 45),
  Weight = c(60, 65, 70, 75, 80),
  BP = c(120, 125, 130, 135, 140)
)

patients
Step 2: Descriptive Statistics
# Mean
mean(patients$Age)

# Median
median(patients$Weight)

# Summary
summary(patients)
Step 3: Data Visualization
# Bar plot
barplot(patients$Weight, col="blue", main="Weight Distribution")

# Histogram
hist(patients$Age, col="green", main="Age Distribution")
Step 4: Correlation Analysis
cor(patients$Age, patients$BP)
This shows the relationship between age and blood pressure.
Example: Biostatistics Dataset
| Patient ID | Age | Weight (kg) | Blood Pressure |
|---|---|---|---|
| 1 | 25 | 60 | 120 |
| 2 | 30 | 65 | 125 |
| 3 | 35 | 70 | 130 |
| 4 | 40 | 75 | 135 |
| 5 | 45 | 80 | 140 |
Interpretation
- As age increases, blood pressure also increases
- This indicates a positive correlation
- Useful in medical risk assessment
Common Biostatistical Functions in R
| Function | Purpose |
|---|---|
mean() | Average |
median() | Middle value |
sd() | Standard deviation |
var() | Variance |
summary() | Overview statistics |
table() | Frequency count |
Applications of Biostatistics
Biostatistics is used in:
- Clinical trials
- Epidemiology studies
- Drug development
- Public health research
- Genetic studie
Advantages of Using RStudio in Biostatistics
- Handles large datasets efficiently
- Provides reproducible research
- Supports advanced statistical modeling
- Excellent visualization capabilities
Conclusion
Biostatistics is a powerful tool in modern healthcare and research. By learning how to use RStudio, beginners can easily perform statistical analysis, visualize data, and interpret results effectively.
This guide introduced you to essential concepts, practical examples, and step-by-step methods to get started. With regular practice, you can advance to more complex analyses like regression, survival analysis, and machine learning.