

Big Data in Biostatistics: Applications, Methods, and Future Trends
Introduction The rapid growth of biological, medical, and healthcare data has transformed the way researchers


Big Data in Biostatistics: Applications, Methods, and Future Trends
Introduction The rapid growth of biological, medical, and healthcare data has transformed the way researchers conduct scientific investigations. Modern research generates enormous amounts of information from clinical trials, electronic health records, genomic sequencing,
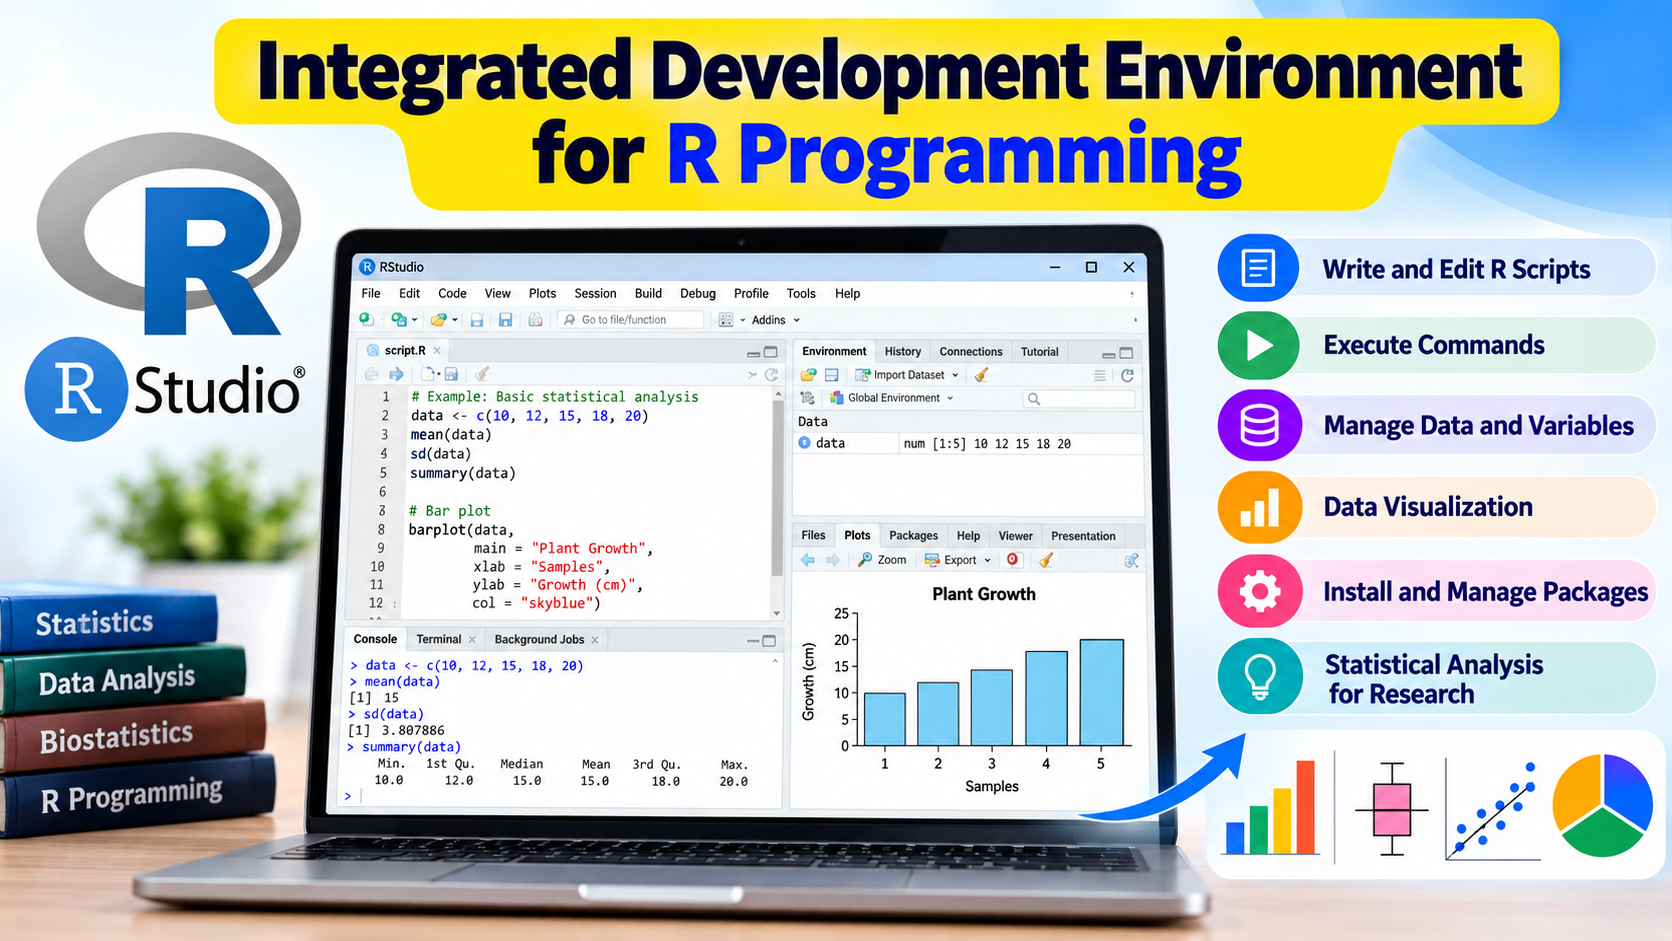
Integrated Development Environment for R Programming: A Complete Beginner’s Guide
Introduction R programming is widely used in statistics, data analysis, bioinformatics, and scientific research. Researchers and students use R to perform statistical tests, analyze experimental data, and create publication-quality graphs. However, writing and
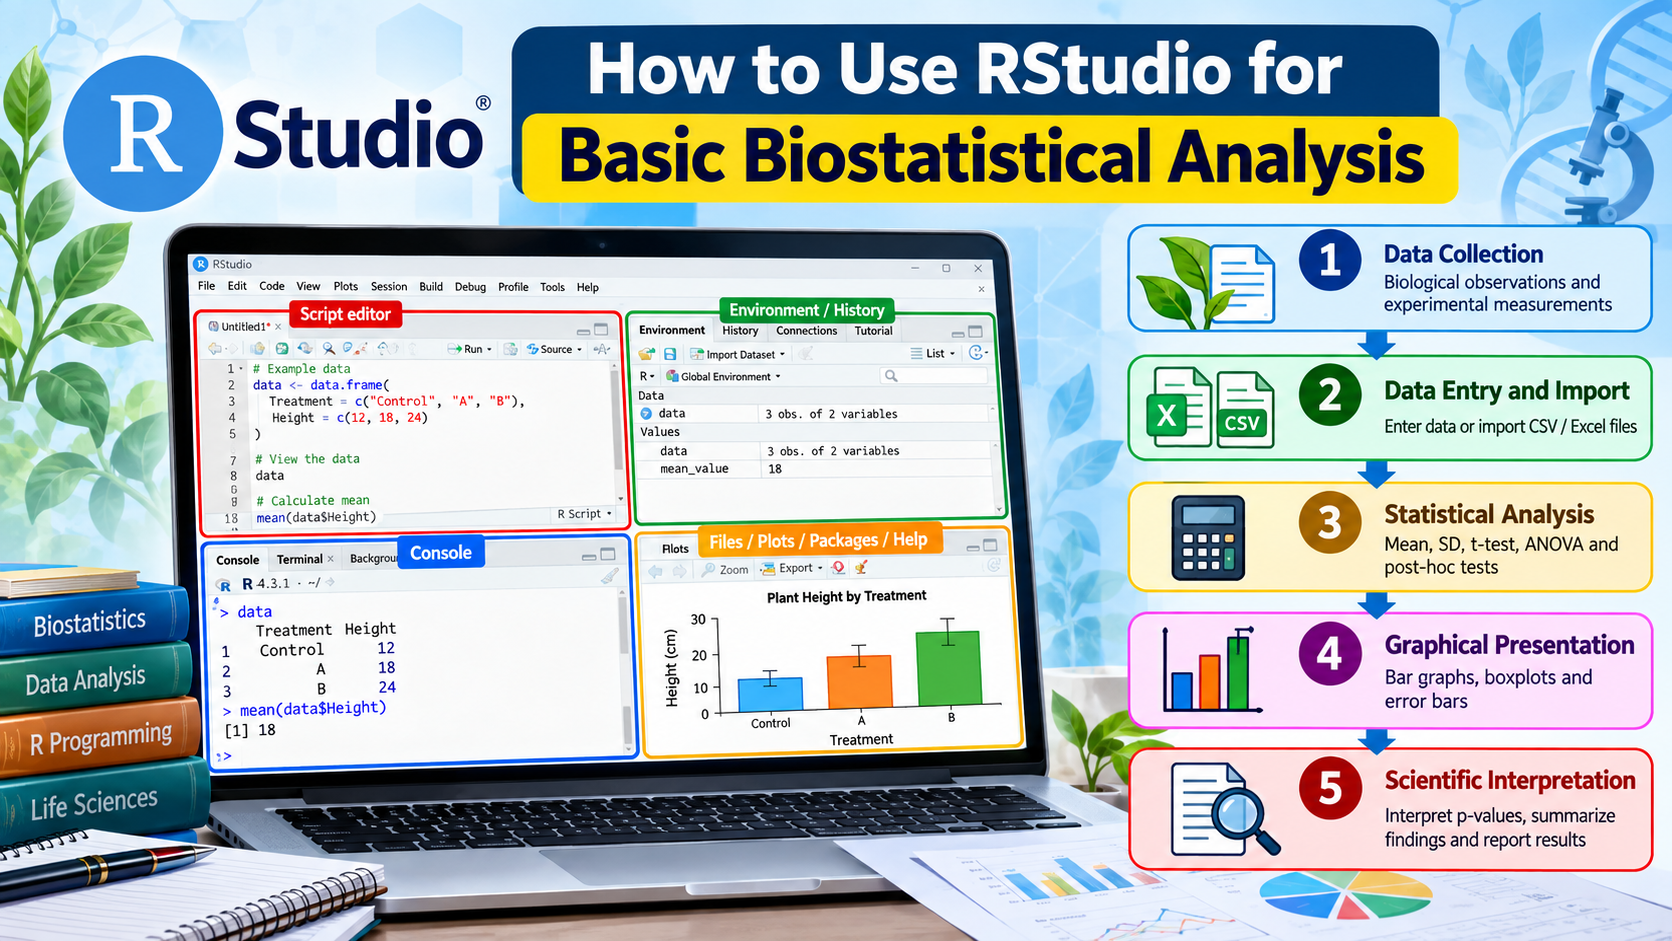
How to Use RStudio for Basic Biostatistical Analysis
1. Introduction Biostatistics plays an essential role in biological research, healthcare, biotechnology, microbiology, zoology, botany, and environmental sciences. Researchers frequently collect experimental data and use statistical methods to identify differences, relationships, and patterns
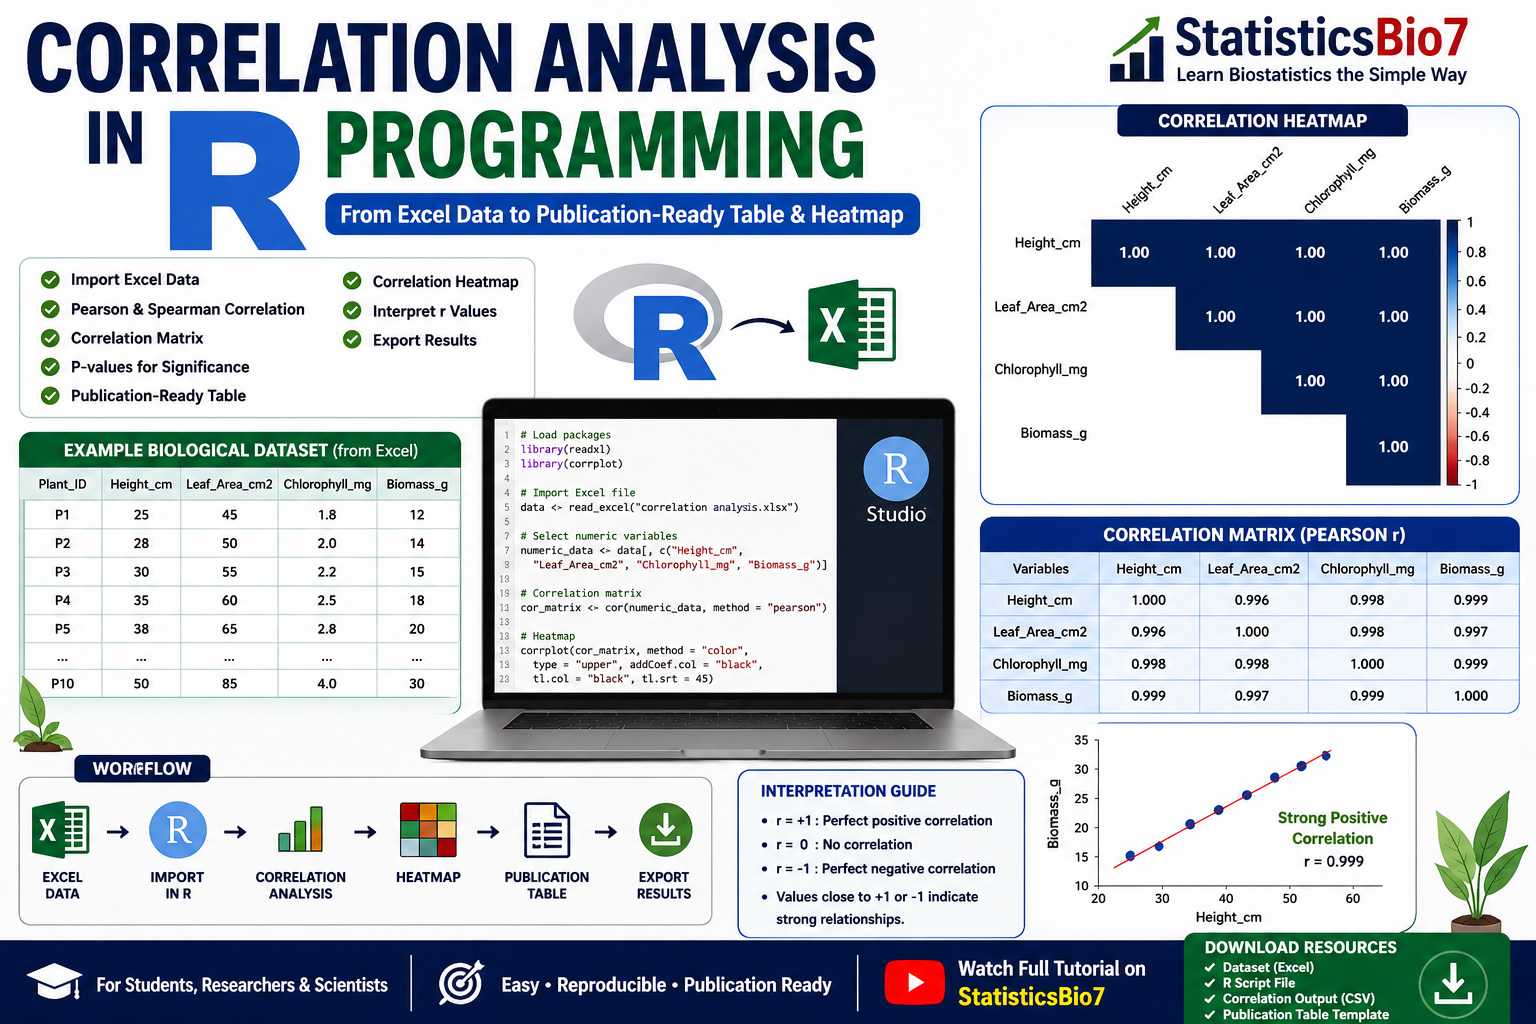
Correlation Analysis in R Programming: Create Correlation Matrix, Heatmap, and Publication-Ready Tables
Introduction Correlation analysis is one of the most widely used statistical techniques in biological, environmental, agricultural, and medical research. Researchers often need to determine whether two or more variables are associated and how
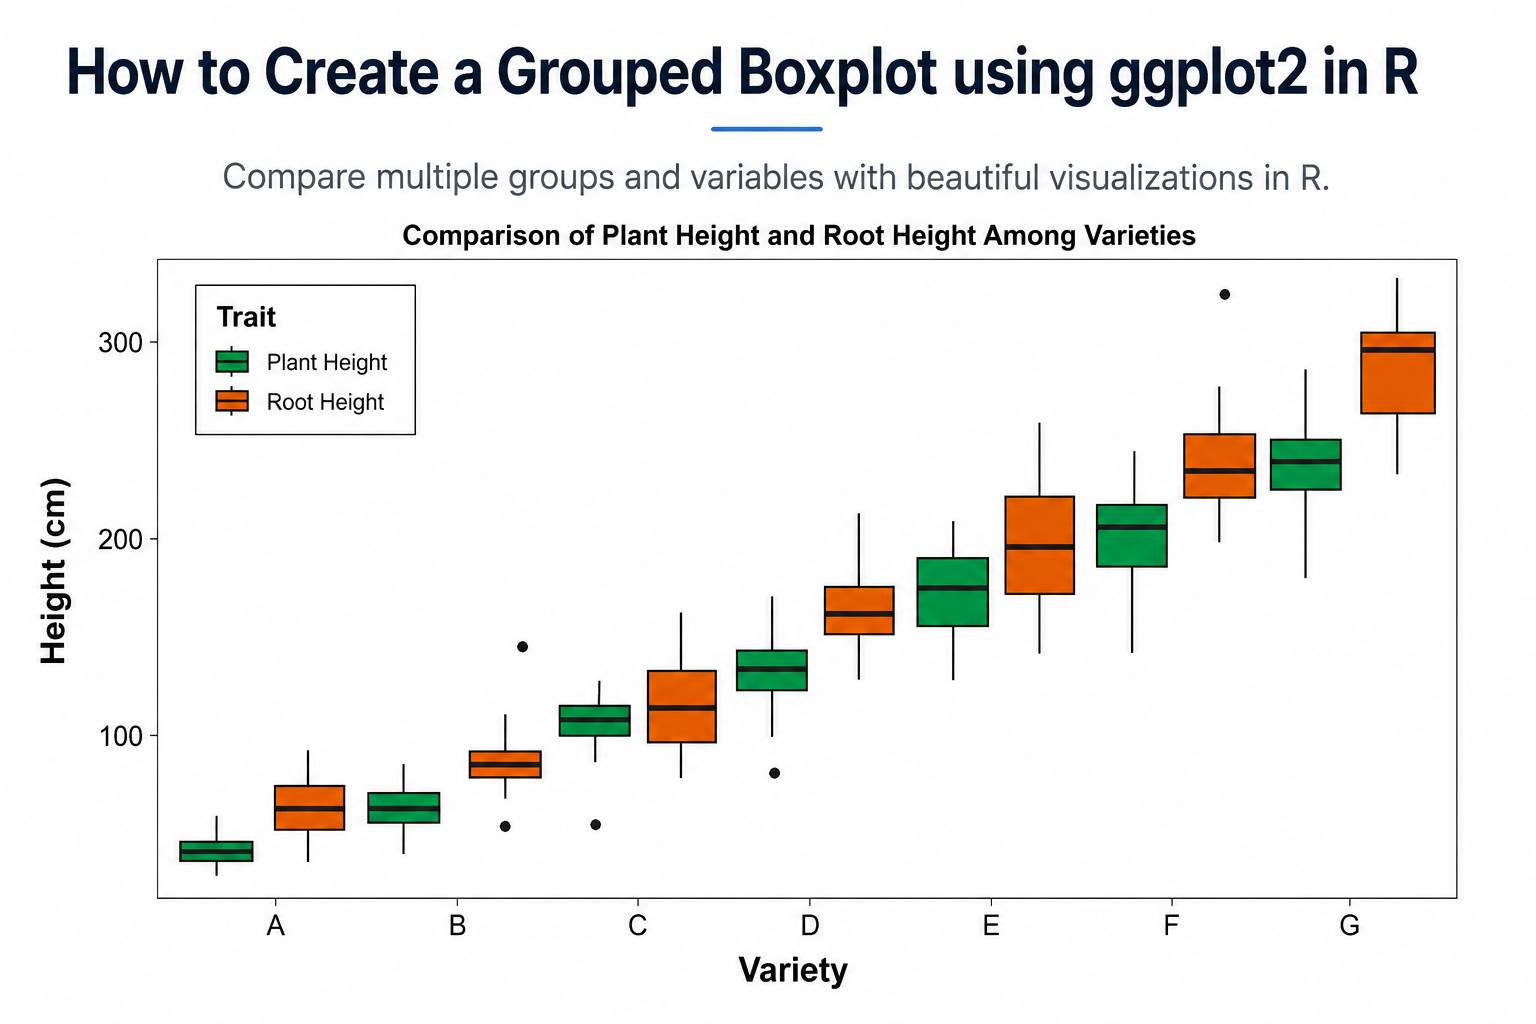
How to Create a Grouped Boxplot using ggplot2 in R | Compare Multiple Groups with ggplot2
Introduction Data visualization is one of the most important steps in statistical analysis because it helps researchers understand patterns, variability, and differences among groups. Among various visualization techniques, the boxplot is widely used
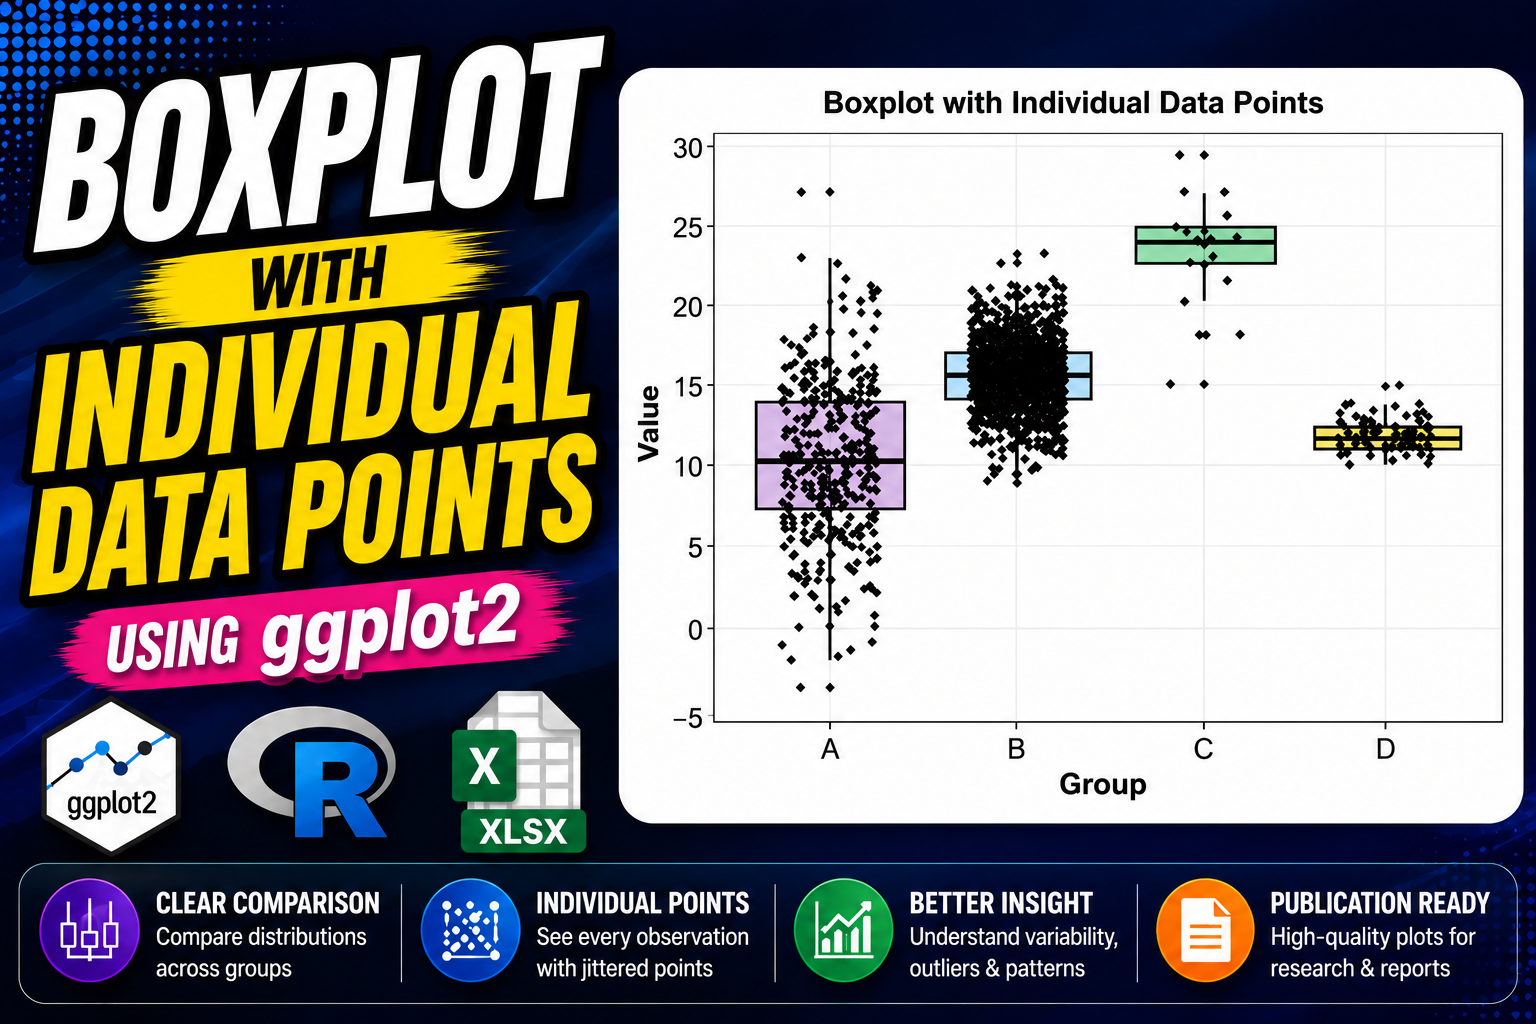
How to Create a Boxplot with Individual Data Points in R Using ggplot2
Introduction Data visualization is a crucial component of statistical analysis and scientific research. When working with biological, biomedical, environmental, or clinical datasets, researchers often need to compare distributions among different groups. Although boxplots
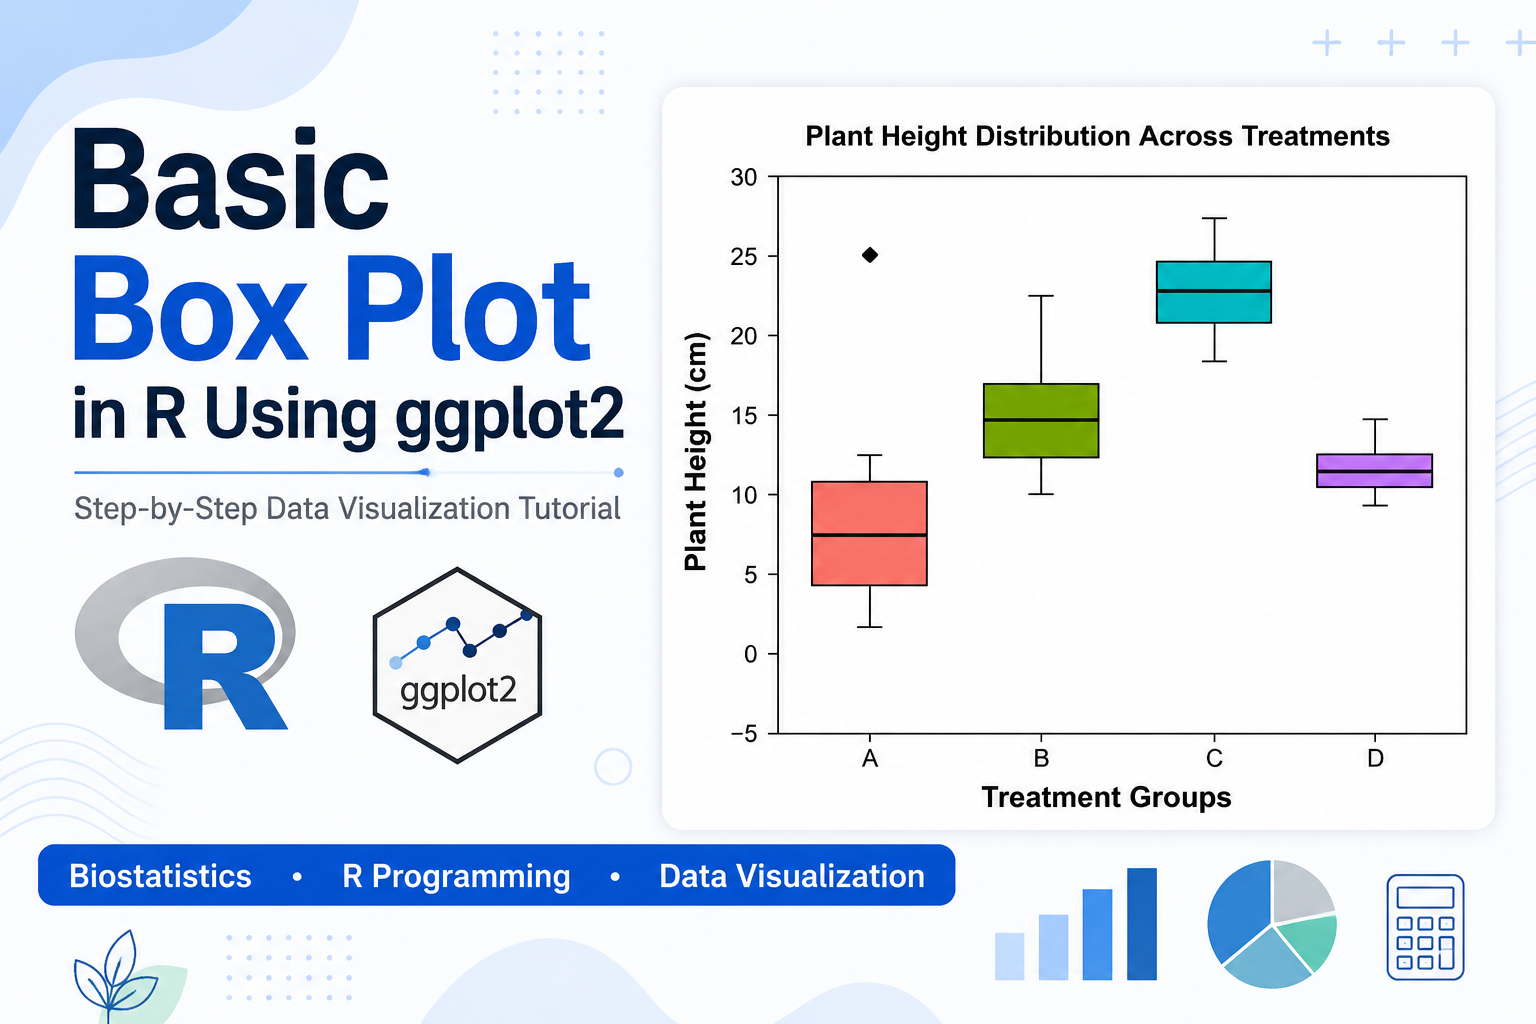
How to Create a Basic Box Plot in R Using ggplot2: Step-by-Step Guide with Biological Data
Introduction Data visualization is an essential part of data analysis in biology, biostatistics, bioinformatics, agriculture, and medical research. Before performing advanced statistical analyses, researchers often use graphical techniques to understand the distribution and
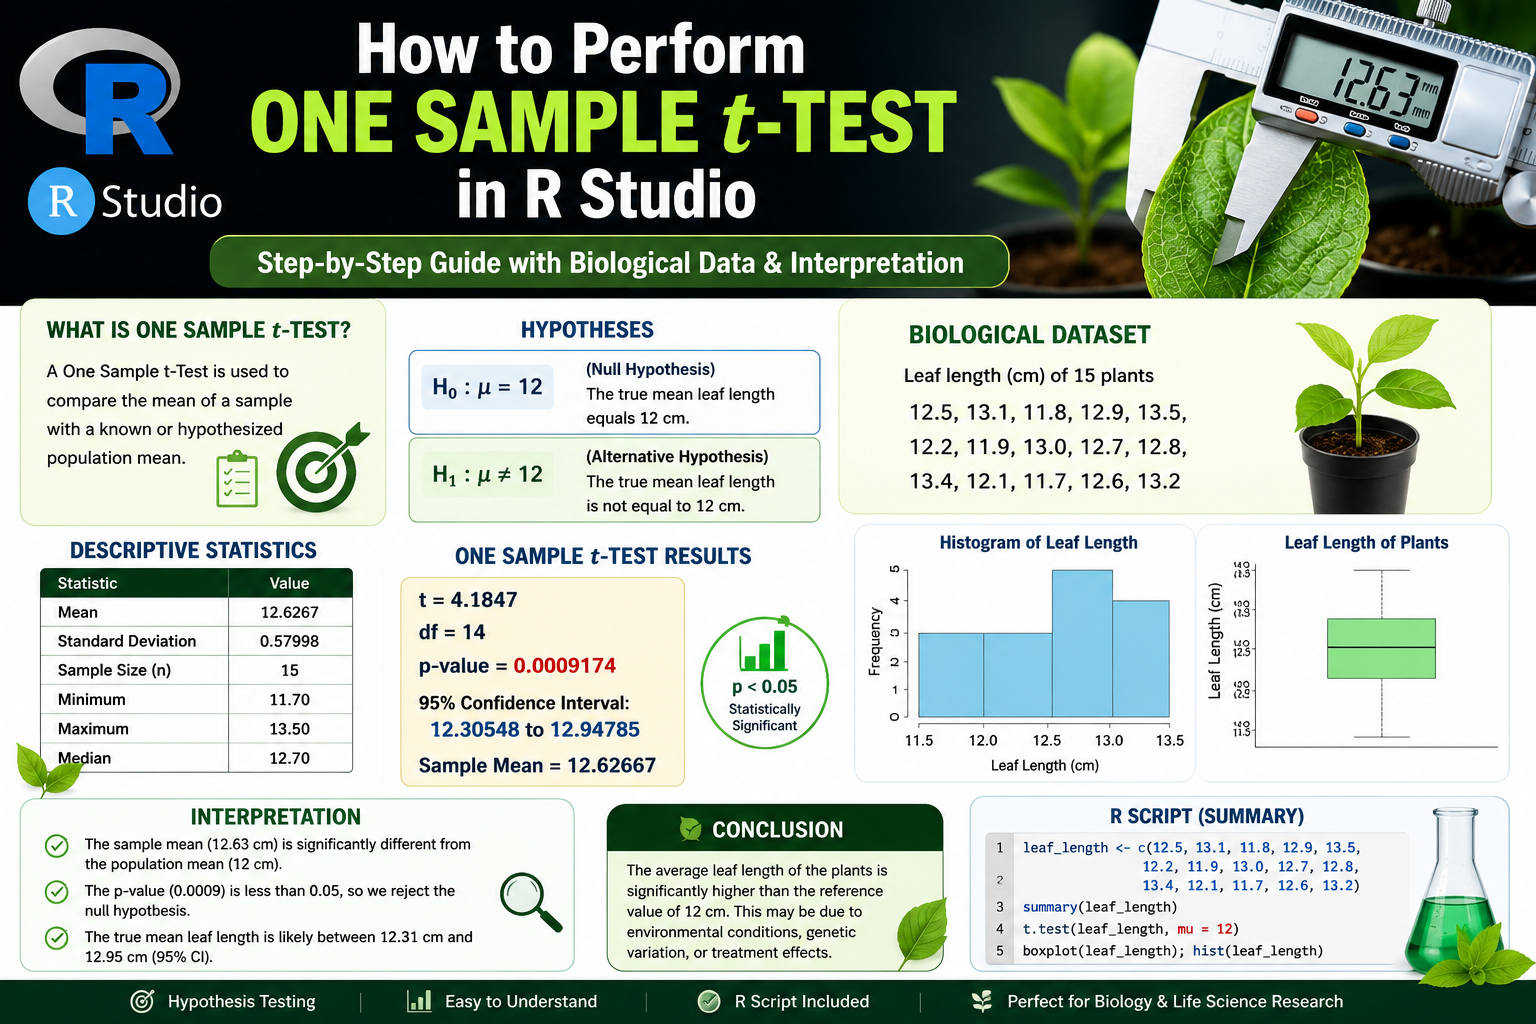
How to Perform One Sample t-Test in R Studio Using Biological Data: Complete Step-by-Step Guide
Introduction Statistical hypothesis testing is a fundamental component of biological research. Researchers frequently need to determine whether the mean value observed in a sample differs significantly from a known or expected population value.