Skip to content
NextGenBiostat
  • Home
  • Contact
  • About Us
  • Bio Statistics
    • Artificial Intelligence
    • Big Data
    • Deep Learning
    • Machine Learning
    • Statistics Basics
    • Statistical Programming
  • R Programming
    • Data Visualization in R
    • Data Analysis in R

R Programming

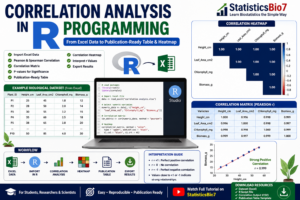
Correlation Analysis in R Programming: Create Correlation Matrix, Heatmap, and Publication-Ready Tables
July 5, 2026 by NextGenBiostat

Introduction Correlation analysis is one of the most widely used statistical techniques in biological, environmental, agricultural, and medical research. Researchers often need to determine whether two or more variables are associated and how strongly they are related. For example, a … Read more
Categories Data Analysis in R, R Programming

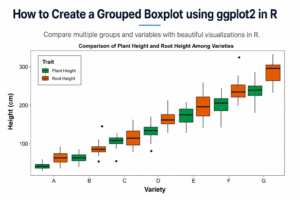
How to Create a Grouped Boxplot using ggplot2 in R | Compare Multiple Groups with ggplot2

June 9, 2026 by NextGenBiostat

Introduction Data visualization is one of the most important steps in statistical analysis because it helps researchers understand patterns, variability, and differences among groups. Among various visualization techniques, the boxplot is widely used for displaying the distribution of numerical data. … Read more

Categories Data Visualization in R, R Programming

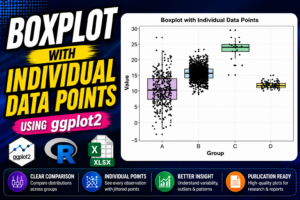
How to Create a Boxplot with Individual Data Points in R Using ggplot2

June 6, 2026 by NextGenBiostat

Introduction Data visualization is a crucial component of statistical analysis and scientific research. When working with biological, biomedical, environmental, or clinical datasets, researchers often need to compare distributions among different groups. Although boxplots provide an excellent summary of data distributions, … Read more

Categories Data Visualization in R, R Programming

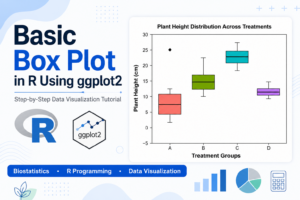
How to Create a Basic Box Plot in R Using ggplot2: Step-by-Step Guide with Biological Data

June 1, 2026 by NextGenBiostat

Introduction Data visualization is an essential part of data analysis in biology, biostatistics, bioinformatics, agriculture, and medical research. Before performing advanced statistical analyses, researchers often use graphical techniques to understand the distribution and variability of their data. One of the … Read more

Categories Data Visualization in R, R Programming

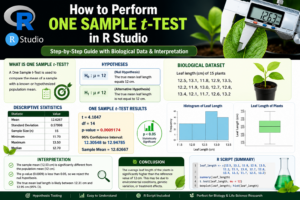
How to Perform One Sample t-Test in R Studio Using Biological Data: Complete Step-by-Step Guide

May 20, 2026 by NextGenBiostat

Introduction Statistical hypothesis testing is a fundamental component of biological research. Researchers frequently need to determine whether the mean value observed in a sample differs significantly from a known or expected population value. In such situations, the One Sample t-Test … Read more

Categories Data Analysis in R, R Programming

How to Create Combination Graph in R Studio | Bar and Line Graph Using Biological Data

May 18, 2026 by NextGenBiostat

Introduction Data visualization is one of the most important techniques in biostatistics, bioinformatics, ecology, and biological research. Researchers often work with multiple biological variables that need to be compared simultaneously. In such cases, a simple graph may not clearly represent … Read more

Categories Data Visualization in R, R Programming

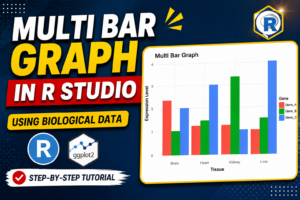
How to Create Multi Bar Graph in R Studio Using Biological Data

May 16, 2026 by NextGenBiostat

Introduction Data visualization is one of the most important parts of biological research and biostatistics. Researchers often need to compare multiple variables across different categories to understand patterns, trends, and relationships in biological datasets. One of the best visualization methods … Read more

Categories Data Visualization in R, R Programming

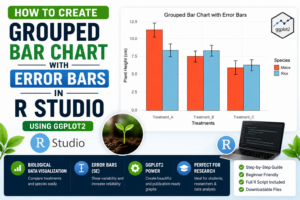
How to Create Grouped Bar Chart with Error Bars in R Studio using ggplot2

May 15, 2026 by NextGenBiostat

Introduction Data visualization is an important part of biological research and biostatistics. Scientists and researchers often use graphs to compare experimental results and clearly present their findings. Among the many visualization techniques available in R Studio, the grouped bar chart … Read more

Categories Data Visualization in R, R Programming

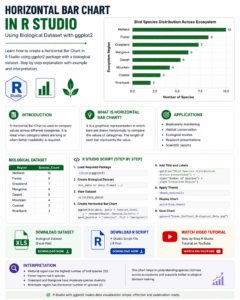
Horizontal Bar Chart in R Studio Using Biological Dataset

May 11, 2026 by NextGenBiostat

Introduction to Horizontal Bar Chart A Horizontal Bar Chart is a graphical representation used to compare categorical data using rectangular horizontal bars. The length of each bar represents the value associated with a specific category. Unlike vertical bar charts, horizontal … Read more

Categories Data Visualization in R, R Programming

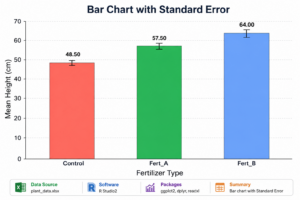
Bar Chart with Standard Error in R Studio Using ggplot2

May 16, 2026May 6, 2026 by NextGenBiostat

Introduction Data visualization is one of the most important parts of statistical analysis and biostatistics. In research studies, scientists and analysts often need to compare group means clearly and effectively. A bar chart is one of the easiest graphical methods … Read more

Categories Data Visualization in R, R Programming
Older posts
Page1 Page2 Next →

Recent Posts

  • Big Data in Biostatistics: Applications, Methods, and Future Trends
  • Integrated Development Environment for R Programming: A Complete Beginner’s Guide
  • How to Use RStudio for Basic Biostatistical Analysis
  • Correlation Analysis in R Programming: Create Correlation Matrix, Heatmap, and Publication-Ready Tables
  • How to Create a Grouped Boxplot using ggplot2 in R | Compare Multiple Groups with ggplot2

Recent Comments

No comments to show.

Archives

  • October 2026 (3)
  • July 2026 (1)
  • June 2026 (3)
  • May 2026 (6)
  • April 2026 (5)
  • March 2026 (2)
  • February 2026 (3)
  • January 2026 (5)

Categories

  • Bio Statistics (14)
    • Artificial Intelligence (2)
    • Big Data (1)
    • Deep Learning (1)
    • Machine Learning (2)
    • Statistical Programming (7)
    • Statistics Basics (1)
  • R Programming (14)
    • Data Analysis in R (3)
    • Data Visualization in R (11)
  • Research Methods (0)

About

NextGenBiostat provides practical tutorials on Biostatistics, R Programming, Data Analysis, Data Visualization, and Statistical Software for students, researchers, and professionals.

Categories

  • Bio Statistics
  • R Programming

Follow Us

  • Facebook
  • Facebook Page
  • LinkedIn
  • YouTube
  • Instagram

Quick Links

  • Home
  • Video Tutorials
  • About Us
  • Contact
  • Disclaimer
  • Privacy Policy
  • Terms & Condition
© 2026 NextGenBiostat - All Rights Reserved!