Create Bar Chart with Standard Deviation in R Using ggplot2

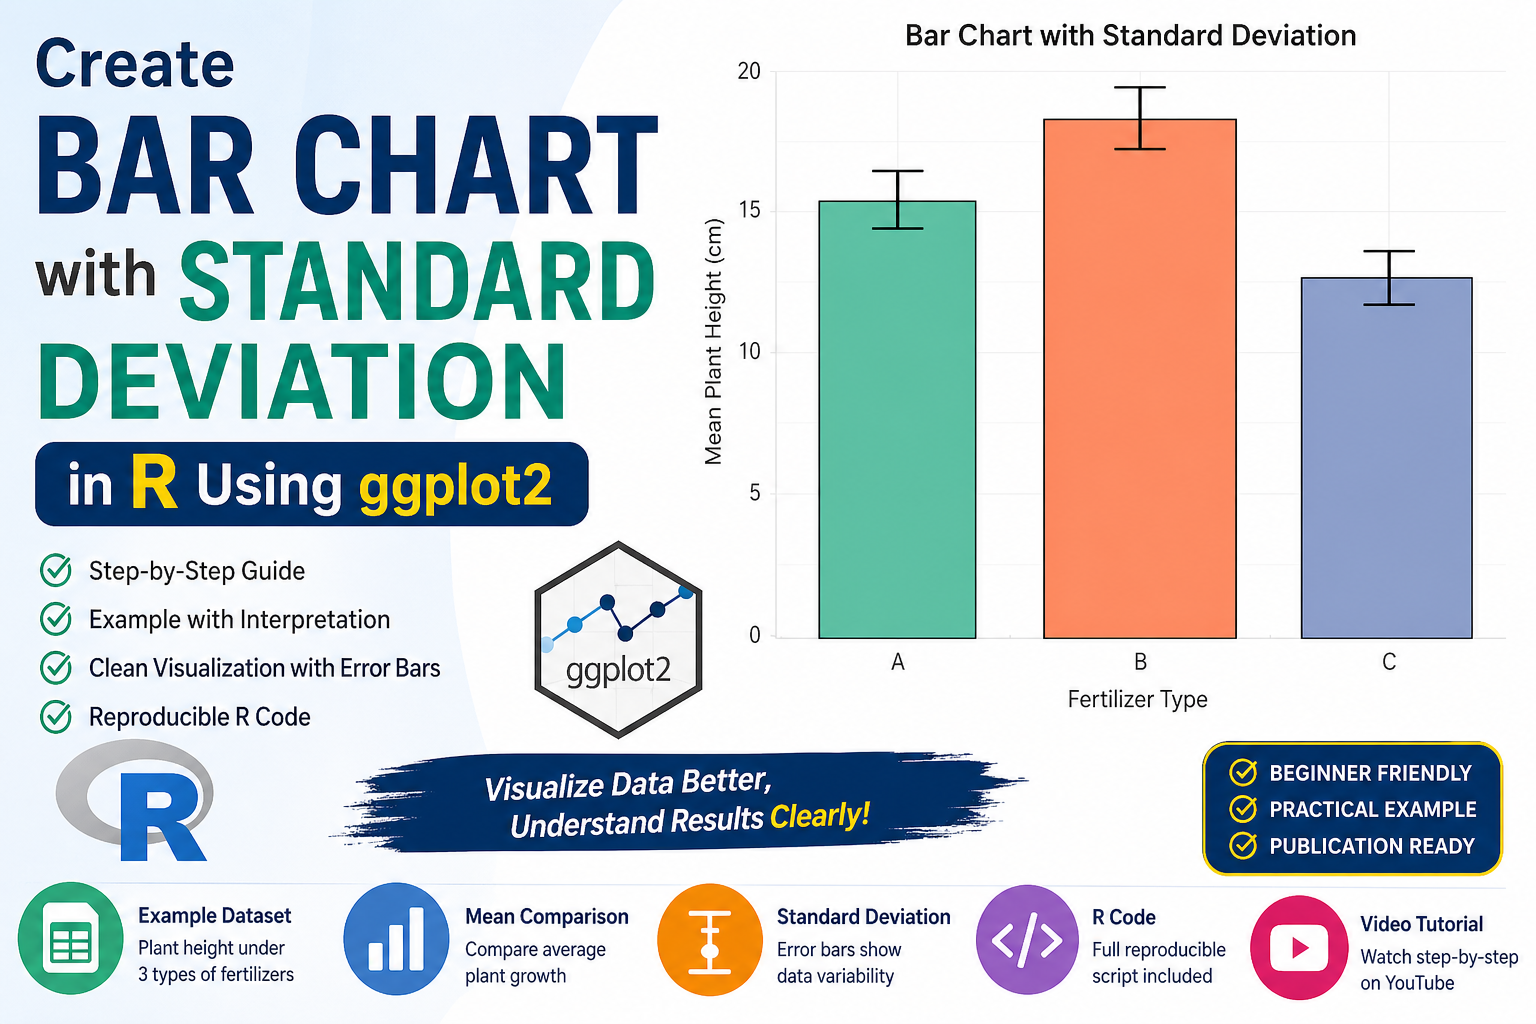
Introduction Data visualization is a crucial part of statistical analysis, especially in fields like biostatistics, agriculture, and data science. Among various visualization techniques, bar charts are widely used to compare categorical data. However, simple bar charts only display averages and fail to show variability in the data. To overcome this limitation, we use standard deviation … Read more

Getting Started with Biostatistics in R: Essential Concepts Explained

Introduction Biostatistics plays a crucial role in modern healthcare, medical research, and life sciences. From analyzing clinical trial data to understanding disease patterns, statistical methods help researchers make evidence-based decisions. With the rise of data-driven research, tools like R have become essential for biostatistical analysis. R is a powerful, open-source statistical programming language widely used … Read more

How to Change Bar Colors Individually in R Barplot

Introduction Data visualization is a critical component of data analysis, especially in fields like biostatistics and biomedical research. Among the many visualization tools available in R, the barplot is one of the simplest and most widely used methods for representing categorical data. In real-world scenarios, using a single color for all bars may not effectively … Read more

Introduction to Biostatistics Using RStudio: A Complete Beginner’s Guide

Introduction Biostatistics is an essential field that combines statistical methods with biological, medical, and public health research. In today’s data-driven healthcare environment, understanding how to analyze and interpret biological data is crucial. Whether you’re a student, researcher, or healthcare professional, learning biostatistics provides the foundation for evidence-based decision-making. With the rise of powerful analytical tools, … Read more

How to Create a Basic Bar Chart in R Studio

Introduction Data visualization is a crucial component of biostatistics, helping researchers and students interpret complex datasets easily. Among the various graphical tools available, the bar chart is one of the simplest and most effective methods for representing categorical data. In this tutorial, you will learn how to create a basic bar chart in R Studio … Read more