Correlation Analysis in R Programming: Create Correlation Matrix, Heatmap, and Publication-Ready Tables
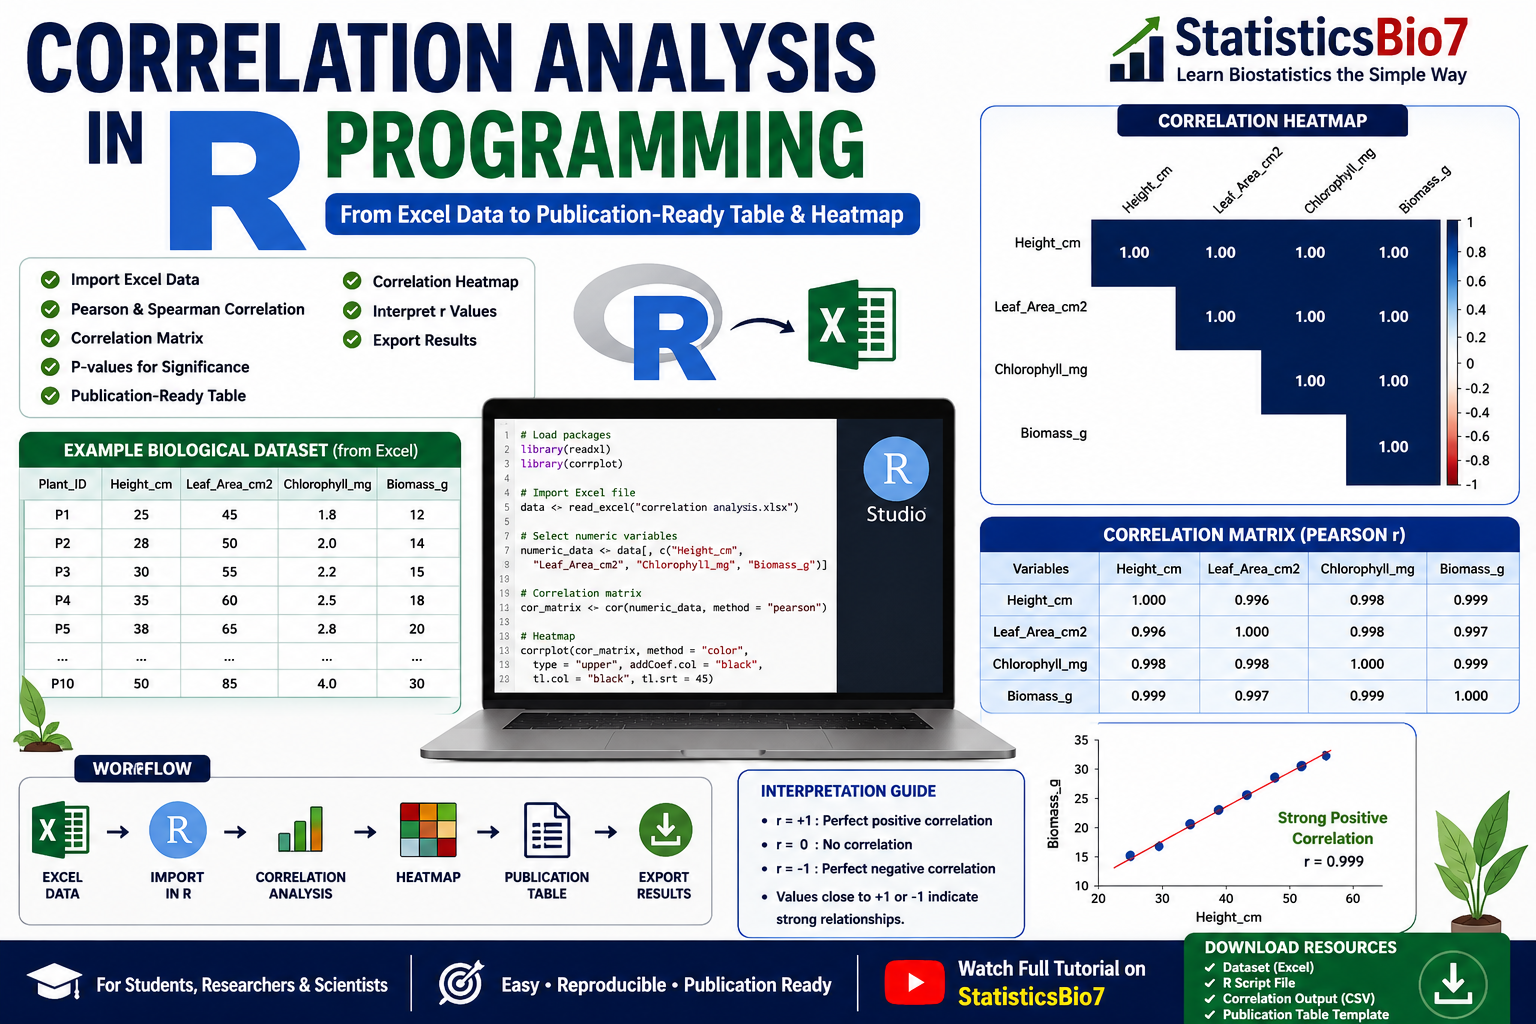
Introduction Correlation analysis is one of the most widely used statistical techniques in biological, environmental, agricultural, and medical research. Researchers often need to determine whether two or more variables are associated and how strongly they are related. For example, a plant scientist may want to know whether plant height is associated with leaf area, chlorophyll … Read more