
Bar Chart with Standard Error in R Studio Using ggplot2
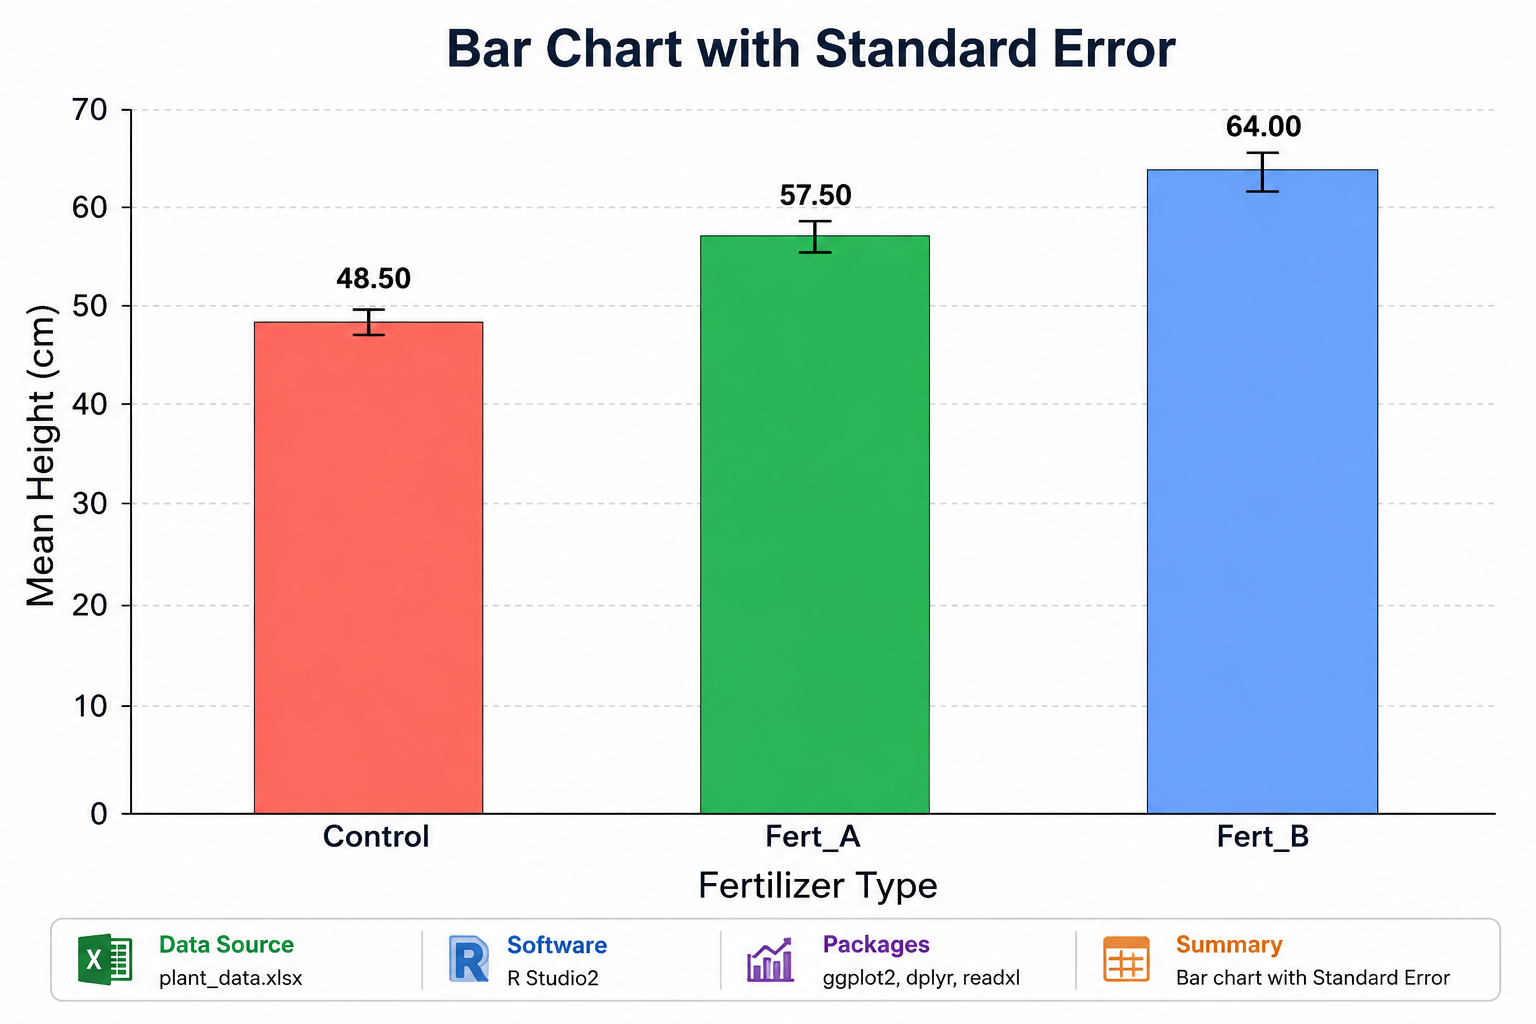
Introduction Data visualization is one of the most important parts of statistical analysis and biostatistics. In research studies, scientists and analysts often need to compare group means clearly and effectively. A bar chart is one of the easiest graphical methods used to display comparisons between categories. However, showing only the mean values is not always … Read more