How to Perform One Sample t-Test in R Studio Using Biological Data: Complete Step-by-Step Guide

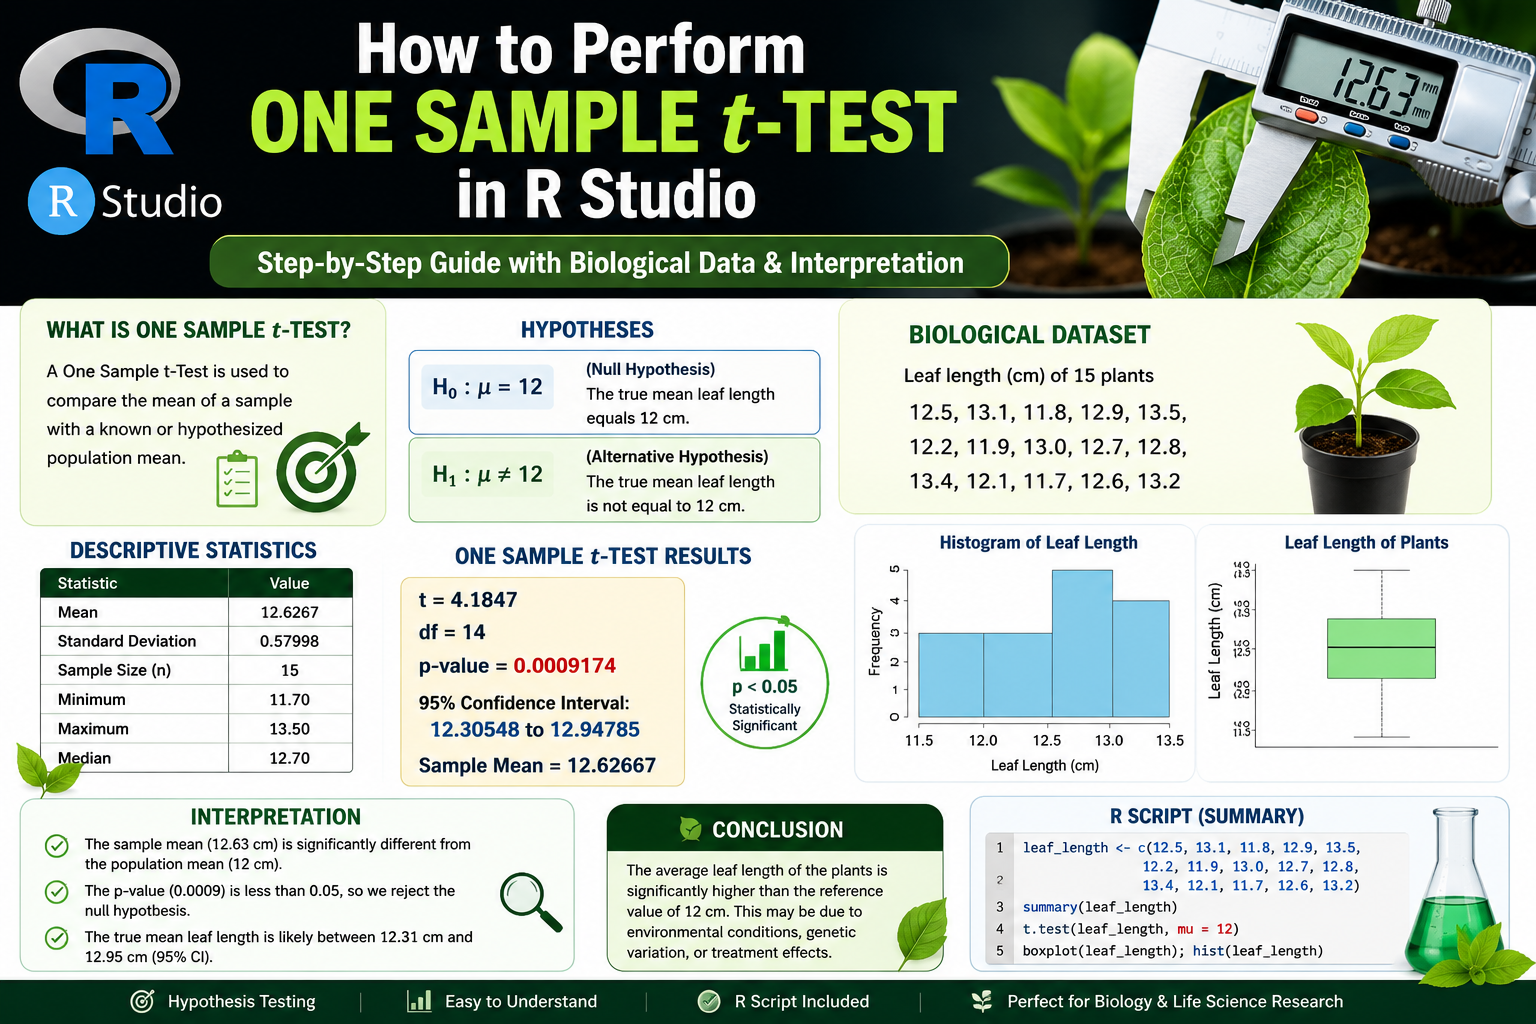
Introduction Statistical hypothesis testing is a fundamental component of biological research. Researchers frequently need to determine whether the mean value observed in a sample differs significantly from a known or expected population value. In such situations, the One Sample t-Test is one of the most commonly used statistical methods. In biological sciences, One Sample t-Tests … Read more

How to Create Combination Graph in R Studio | Bar and Line Graph Using Biological Data

Introduction Data visualization is one of the most important techniques in biostatistics, bioinformatics, ecology, and biological research. Researchers often work with multiple biological variables that need to be compared simultaneously. In such cases, a simple graph may not clearly represent the relationship between variables. A Combination Graph helps solve this problem by displaying two types … Read more

How to Create Multi Bar Graph in R Studio Using Biological Data

Introduction Data visualization is one of the most important parts of biological research and biostatistics. Researchers often need to compare multiple variables across different categories to understand patterns, trends, and relationships in biological datasets. One of the best visualization methods for this purpose is the Multi Bar Graph. A multi bar graph helps compare several … Read more

How to Create Grouped Bar Chart with Error Bars in R Studio using ggplot2

Introduction Data visualization is an important part of biological research and biostatistics. Scientists and researchers often use graphs to compare experimental results and clearly present their findings. Among the many visualization techniques available in R Studio, the grouped bar chart with error bars is one of the most useful methods for displaying biological data. A … Read more

Horizontal Bar Chart in R Studio Using Biological Dataset

Introduction to Horizontal Bar Chart A Horizontal Bar Chart is a graphical representation used to compare categorical data using rectangular horizontal bars. The length of each bar represents the value associated with a specific category. Unlike vertical bar charts, horizontal bar charts display categories on the y-axis and values on the x-axis. This format is … Read more

Bar Chart with Standard Error in R Studio Using ggplot2

Introduction Data visualization is one of the most important parts of statistical analysis and biostatistics. In research studies, scientists and analysts often need to compare group means clearly and effectively. A bar chart is one of the easiest graphical methods used to display comparisons between categories. However, showing only the mean values is not always … Read more