How to Create Combination Graph in R Studio | Bar and Line Graph Using Biological Data

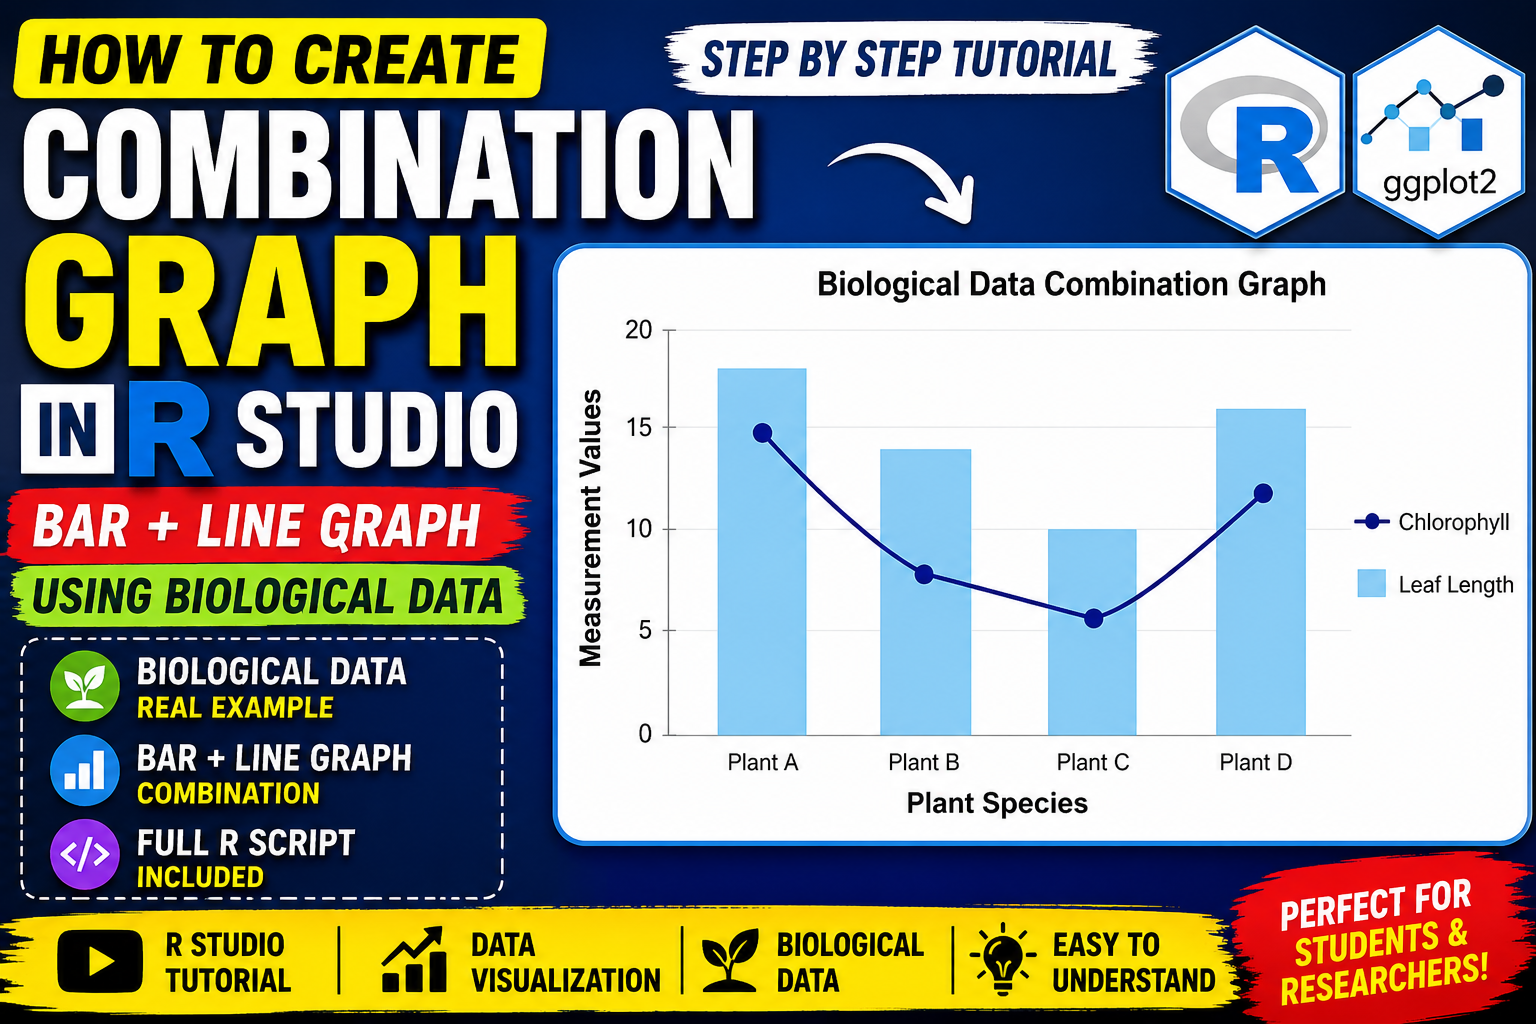
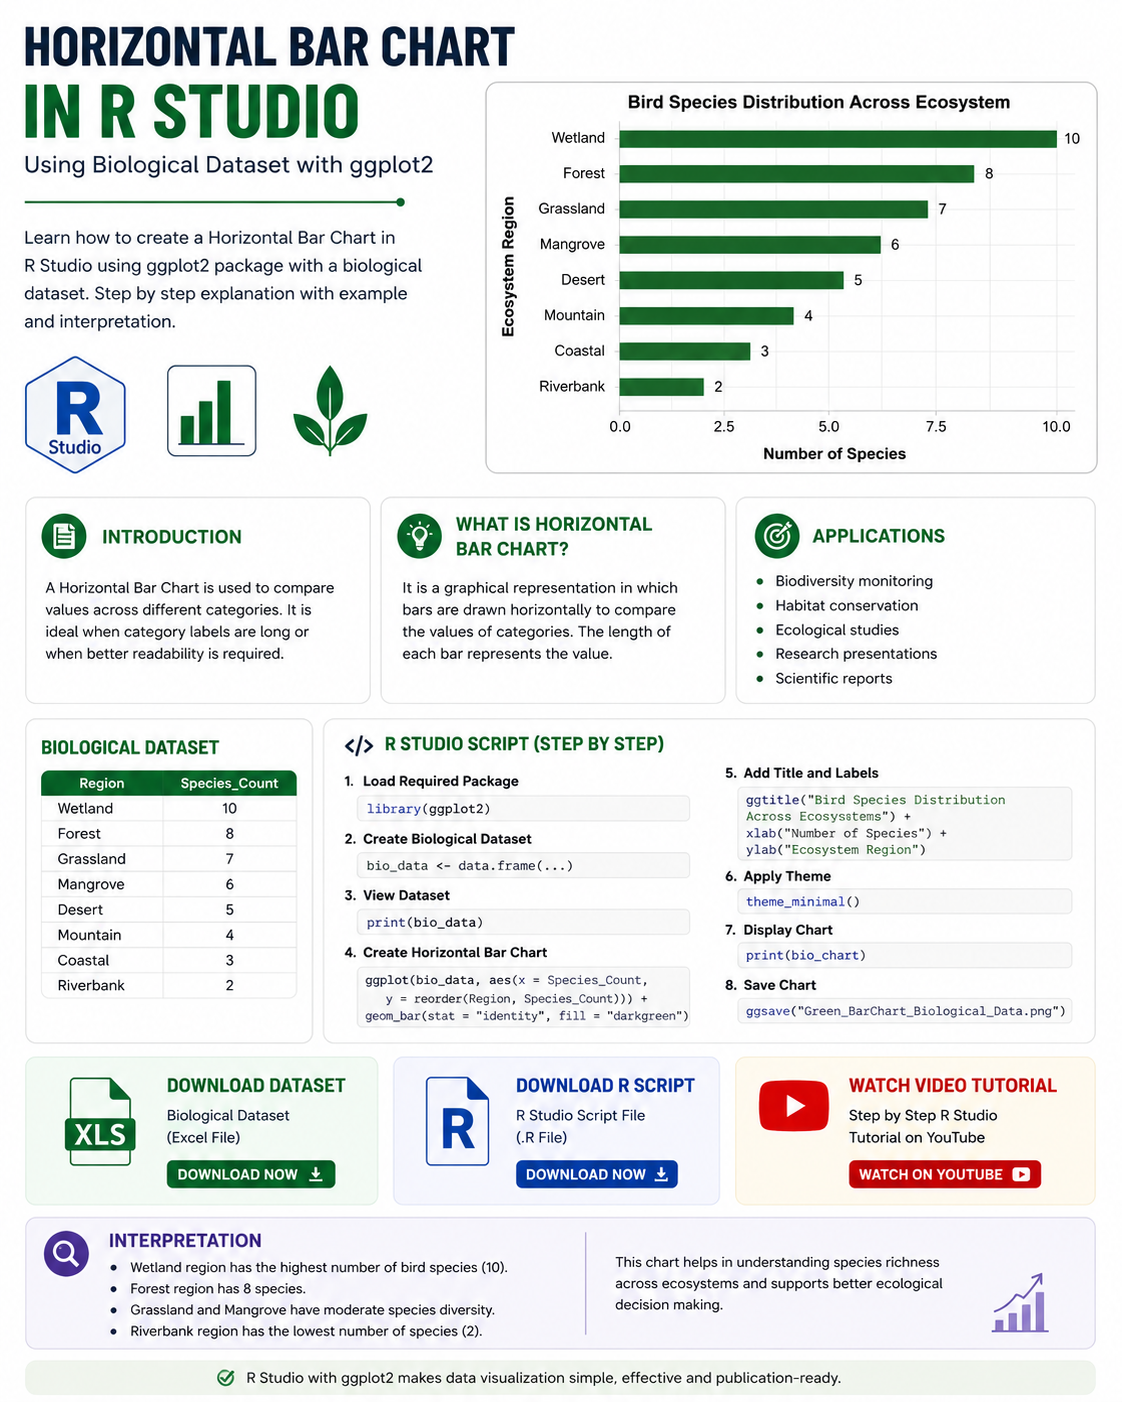
Introduction Data visualization is one of the most important techniques in biostatistics, bioinformatics, ecology, and biological research. Researchers often work with multiple biological variables that need to be compared simultaneously. In such cases, a simple graph may not clearly represent the relationship between variables. A Combination Graph helps solve this problem by displaying two types … Read more

How to Create Multi Bar Graph in R Studio Using Biological Data

Introduction Data visualization is one of the most important parts of biological research and biostatistics. Researchers often need to compare multiple variables across different categories to understand patterns, trends, and relationships in biological datasets. One of the best visualization methods for this purpose is the Multi Bar Graph. A multi bar graph helps compare several … Read more

Horizontal Bar Chart in R Studio Using Biological Dataset

Introduction to Horizontal Bar Chart A Horizontal Bar Chart is a graphical representation used to compare categorical data using rectangular horizontal bars. The length of each bar represents the value associated with a specific category. Unlike vertical bar charts, horizontal bar charts display categories on the y-axis and values on the x-axis. This format is … Read more