
Horizontal Bar Chart in R Studio Using Biological Dataset
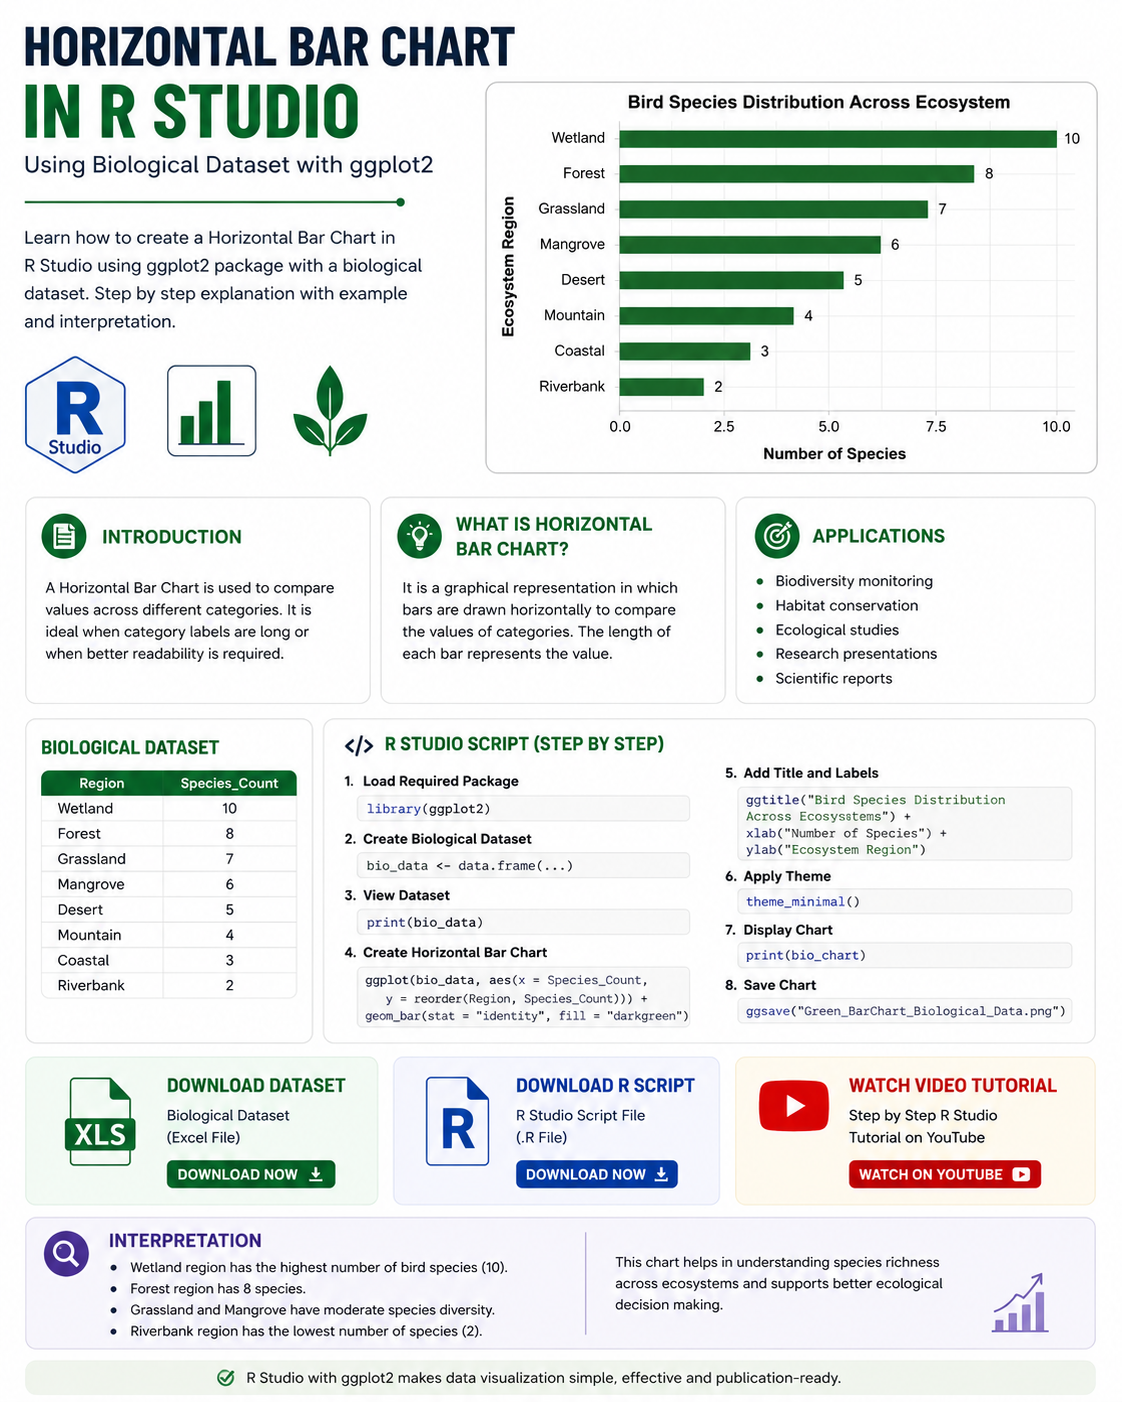
Introduction to Horizontal Bar Chart A Horizontal Bar Chart is a graphical representation used to compare categorical data using rectangular horizontal bars. The length of each bar represents the value associated with a specific category. Unlike vertical bar charts, horizontal bar charts display categories on the y-axis and values on the x-axis. This format is … Read more