How to Create a Basic Box Plot in R Using ggplot2: Step-by-Step Guide with Biological Data
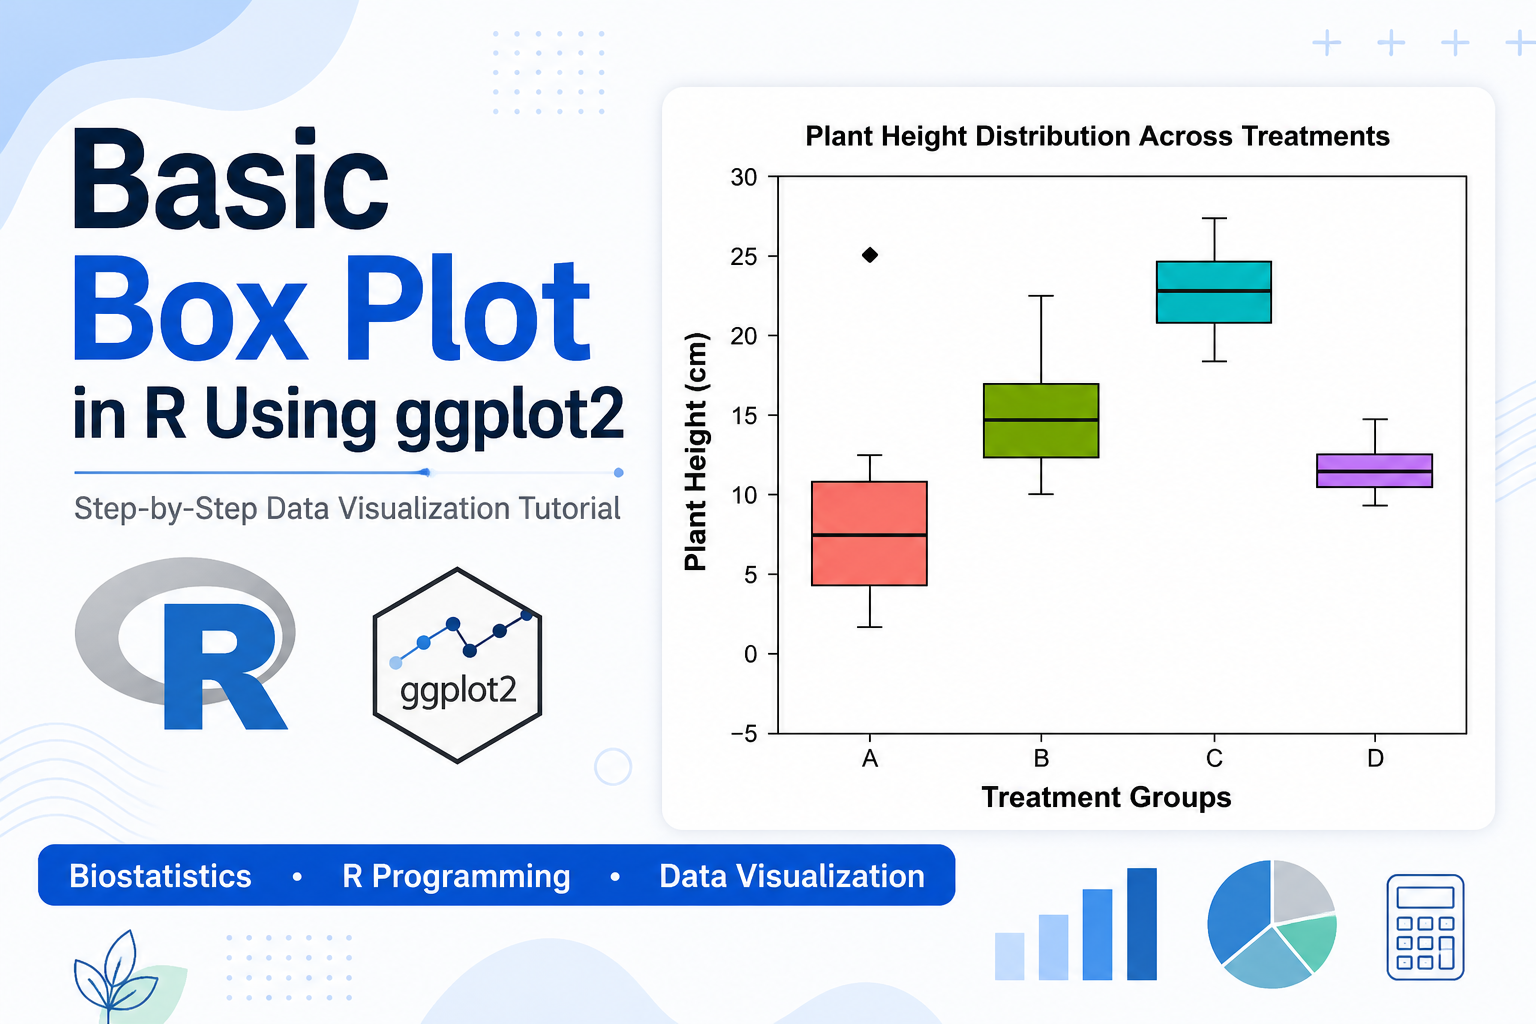
Introduction Data visualization is an essential part of data analysis in biology, biostatistics, bioinformatics, agriculture, and medical research. Before performing advanced statistical analyses, researchers often use graphical techniques to understand the distribution and variability of their data. One of the most effective graphical tools for visualizing data distributions is the box plot, also known as … Read more