
How to Create Grouped Bar Chart with Error Bars in R Studio using ggplot2
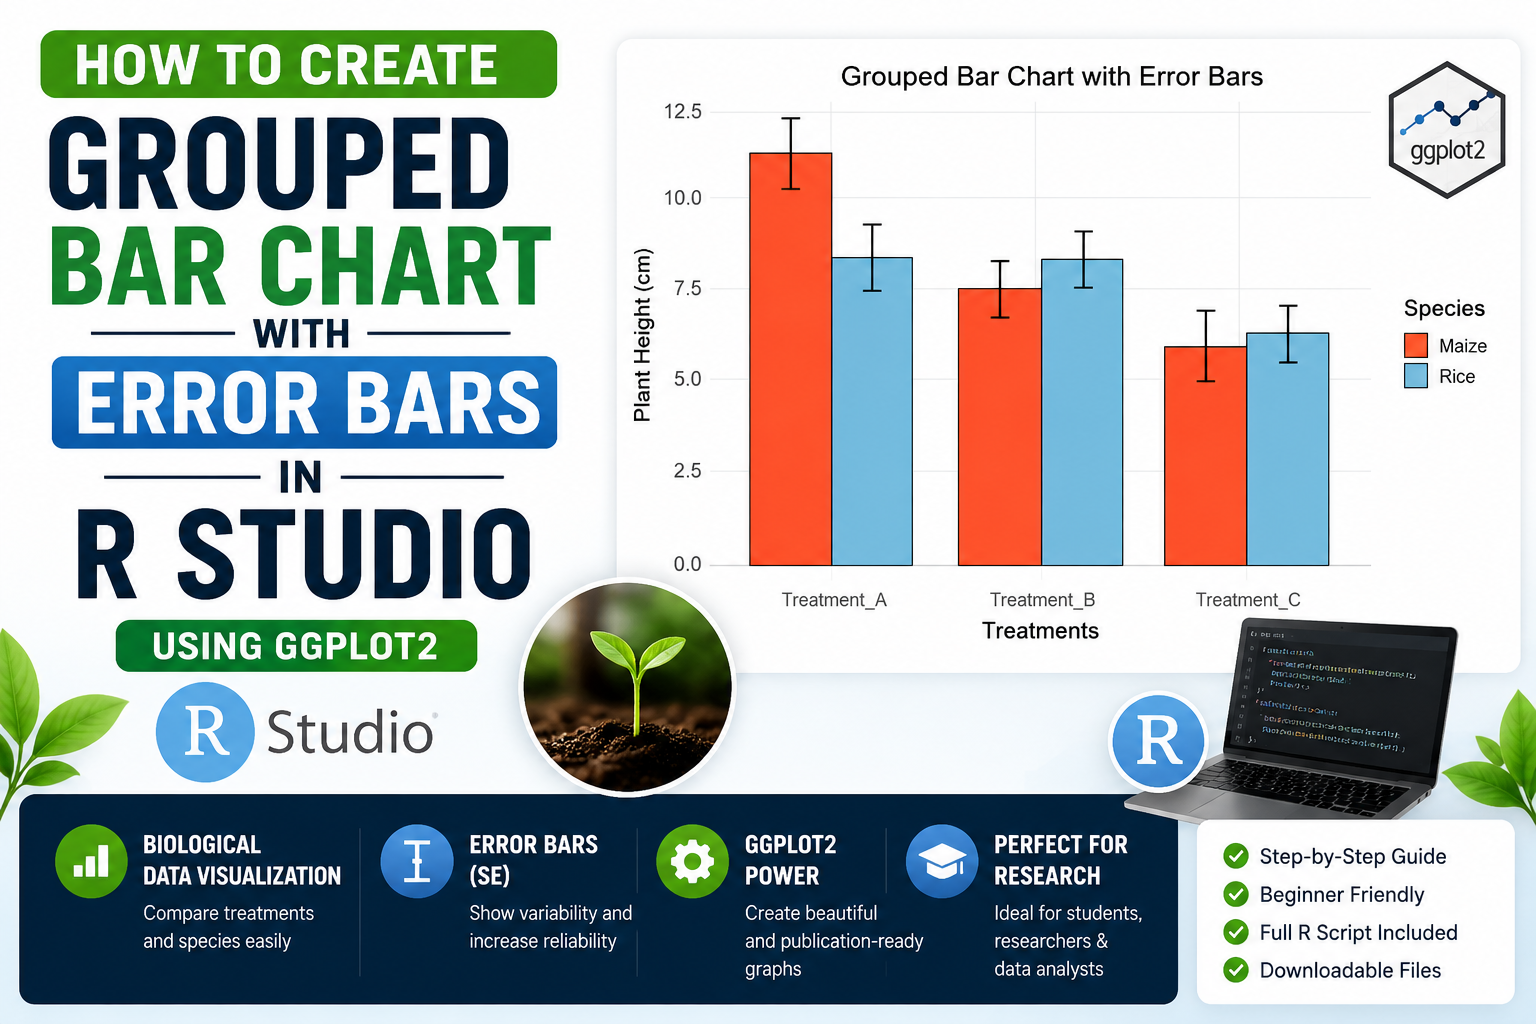
Introduction Data visualization is an important part of biological research and biostatistics. Scientists and researchers often use graphs to compare experimental results and clearly present their findings. Among the many visualization techniques available in R Studio, the grouped bar chart with error bars is one of the most useful methods for displaying biological data. A … Read more