
Introduction
Biostatistics plays a crucial role in biological sciences, medicine, public health, agriculture, and environmental research. With the growing volume of biological data, traditional statistical tools are no longer sufficient. This is where R programming becomes an essential skill for students, researchers, and scientists.
R is a free, open-source statistical programming language widely used in biostatistics for data analysis, visualization, modeling, and reproducible research. From simple descriptive statistics to advanced survival analysis and machine learning, R provides unmatched flexibility and power.
In this article, you will learn how to use R programming in biostatistics, starting from basic concepts to real-world applications. This guide is especially useful for biological science students, PhD scholars, and healthcare researchers.
Why R Programming Is Important in Biostatistics
R has become the backbone of modern biostatistics due to the following reasons:
- Open-source and free
- Large collection of biostatistical packages
- High-quality graphical capabilities
- Strong community support
- Reproducible research using scripts and reports
Unlike point-and-click software, R allows researchers to document every step of analysis, which is critical for scientific transparency.
Key Applications of R in Biostatistics
R is used in almost every domain of biostatistics:
- Clinical trial analysis
- Epidemiological studies
- Genomics and transcriptomics
- Ecological and environmental studies
- Public health surveillance
- Agricultural and veterinary research
Basic Workflow of R Programming in Biostatistics
The typical workflow in R follows these steps:
- Data import
- Data cleaning
- Exploratory data analysis
- Statistical analysis
- Data visualization
- Interpretation and reporting
Installing R and RStudio
To begin using R in biostatistics:
- Download R from CRAN
- Install RStudio (recommended IDE)
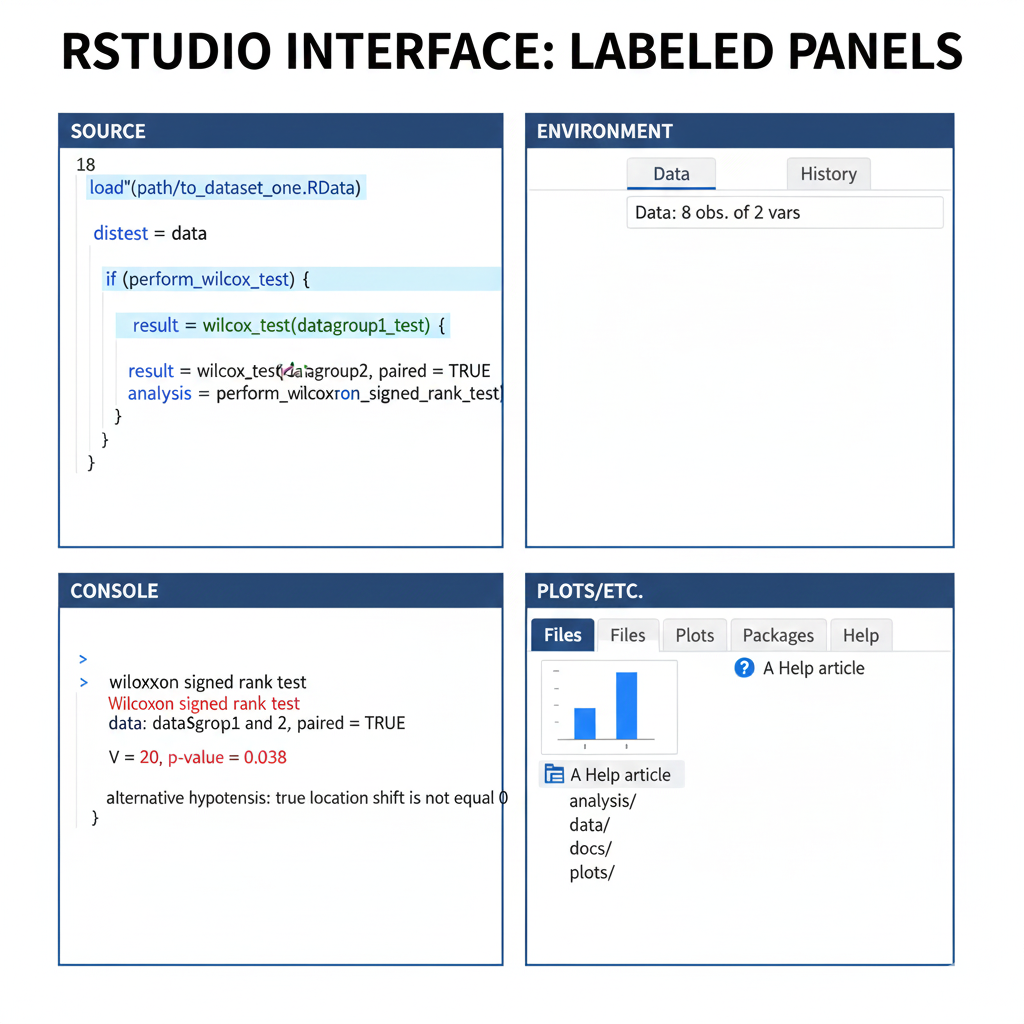
RStudio provides:
- Script editor
- Console
- Environment window
- Plot and package manager
Data Types Commonly Used in Biostatistics
Biostatistical data can be:
- Numerical (height, weight, blood pressure)
- Categorical (gender, treatment group)
- Binary (yes/no, alive/dead)
- Time-to-event (survival data)
Understanding data types is essential before choosing statistical tests.
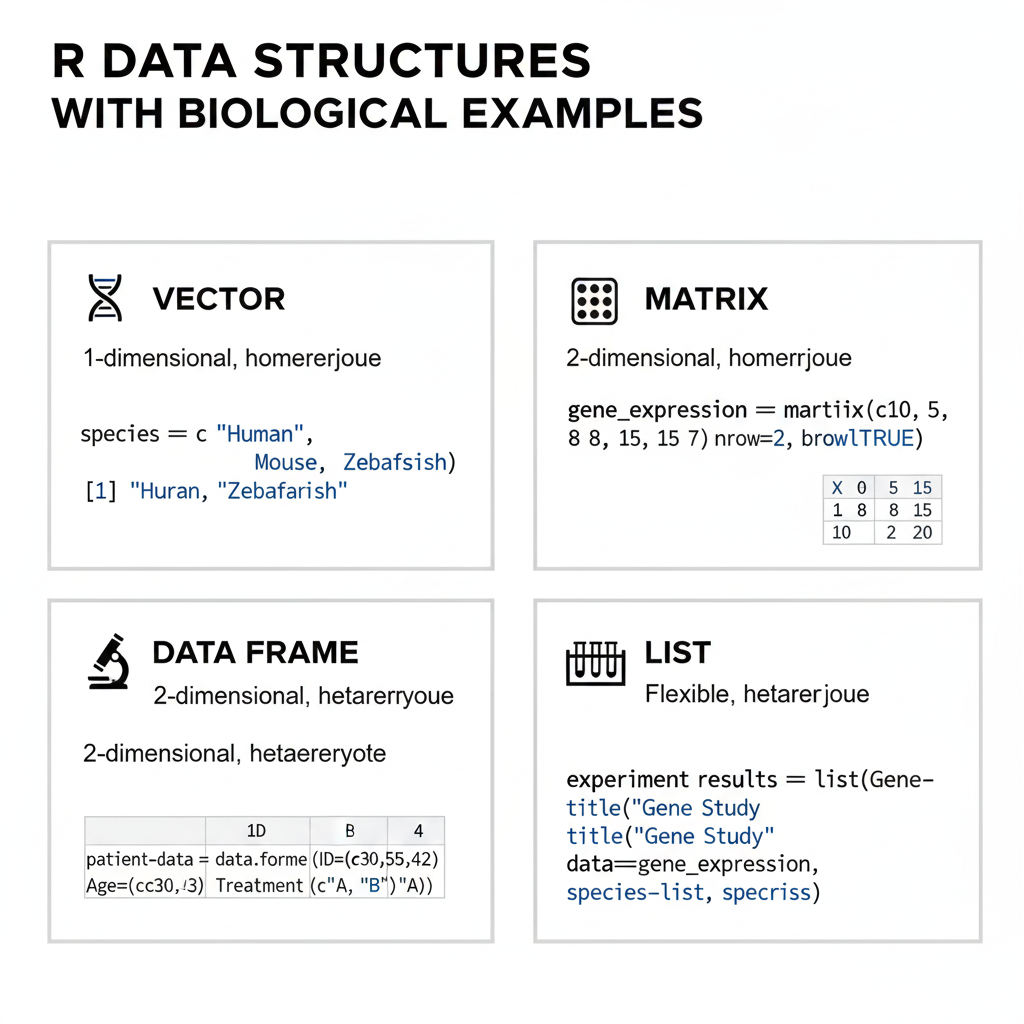
Common Data Structures in R
| Data Structure | Description | Biostatistics Example |
|---|---|---|
| Vector | One-dimensional data | Blood glucose values |
| Data Frame | Tabular data | Clinical trial dataset |
| Matrix | Numeric table | Gene expression matrix |
| Factor | Categorical data | Disease status |
| List | Mixed data types | Model outputs |
Importing Biological Data into R
R supports multiple data formats:
- CSV files
- Excel files
- Text files
- SPSS, SAS, Stata formats
This makes R highly compatible with existing biostatistical workflows.
Descriptive Statistics in R
Descriptive statistics help summarize biological data:
- Mean
- Median
- Standard deviation
- Variance
- Range
These statistics are used to understand data distribution before applying inferential tests.
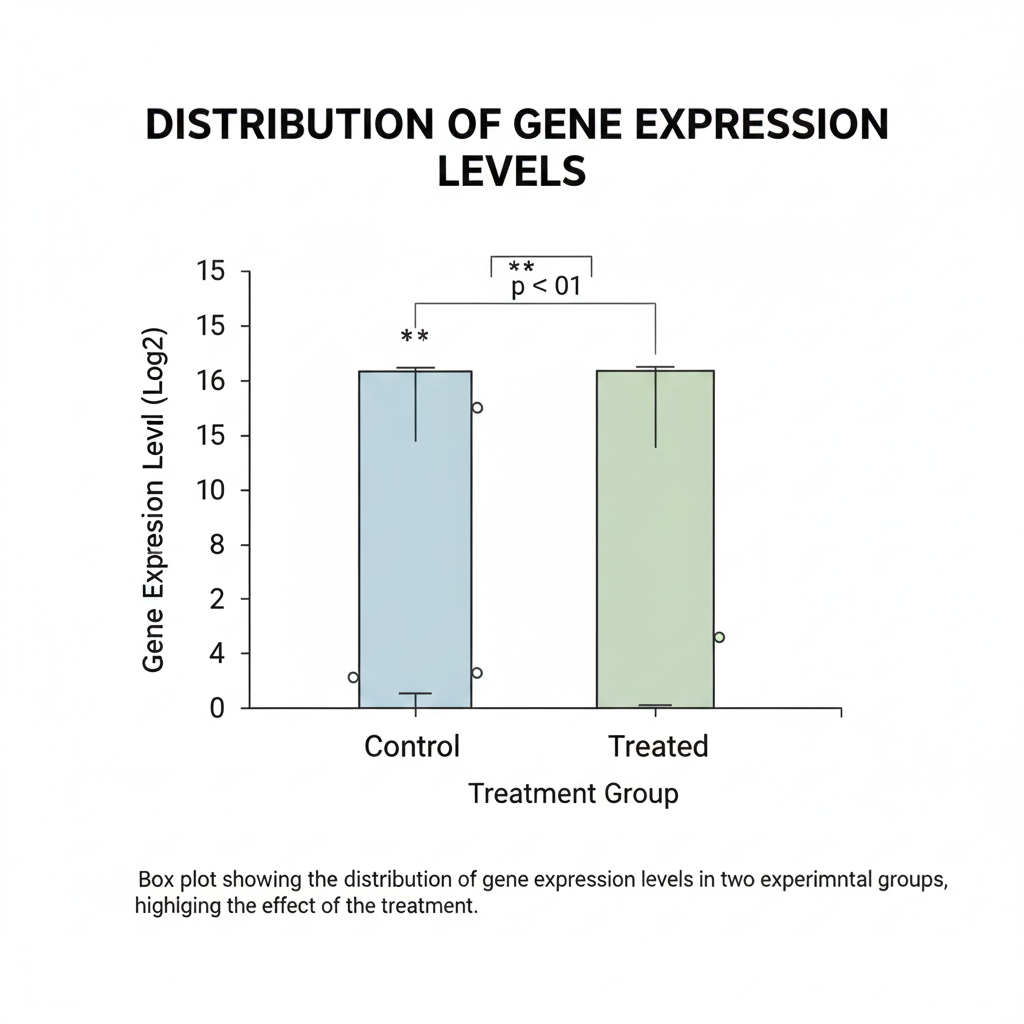
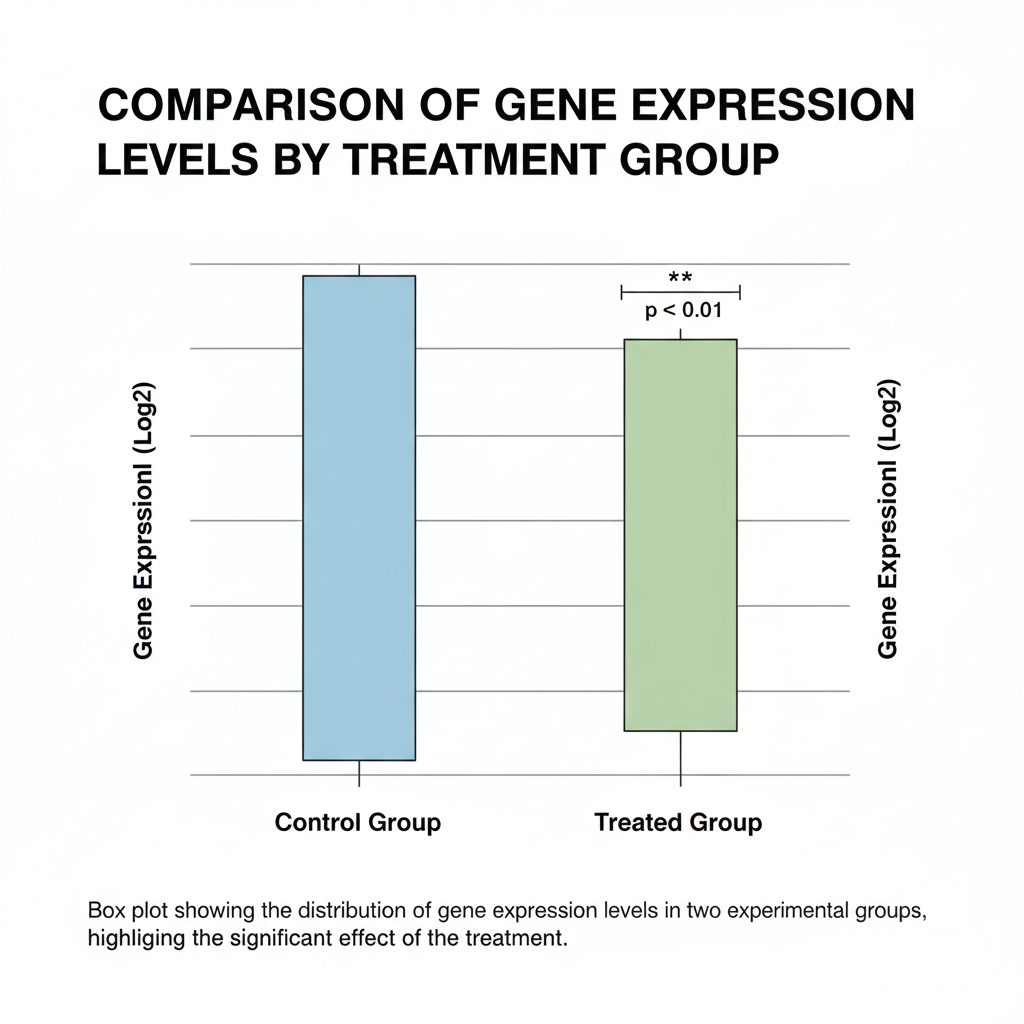
Data Visualization in Biostatistics Using R
Visualization is one of R’s strongest features. Common plots include:
- Histograms
- Boxplots
- Bar charts
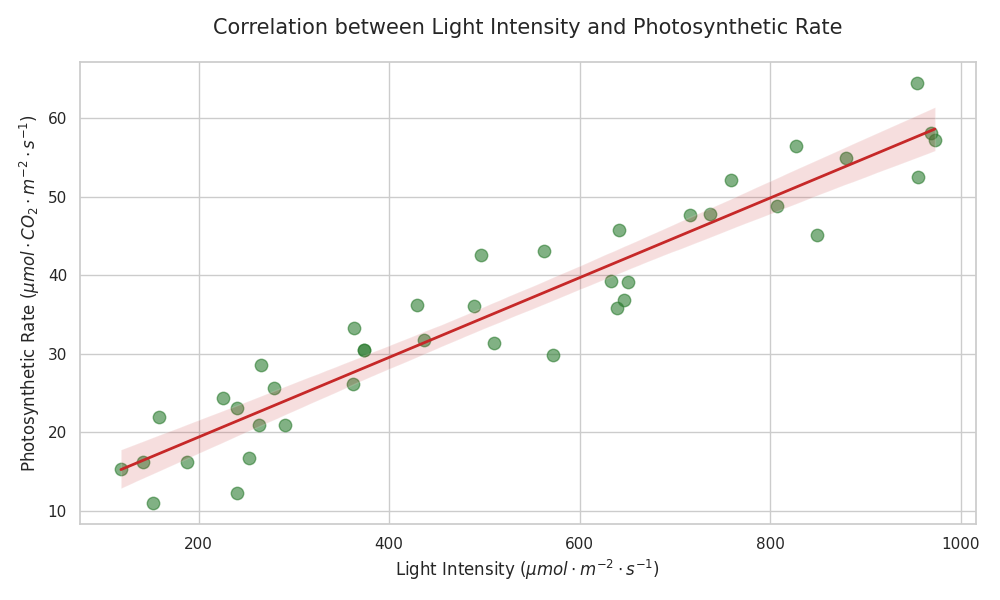
- Scatter plots
- Heatmaps
Visualization helps identify:
- Outliers
- Trends
- Group differences
- Relationships between variables
Hypothesis Testing in R
R supports all major statistical tests used in biostatistics:
Parametric Tests
- t-test
- ANOVA
- Pearson correlation
Non-Parametric Tests
- Mann–Whitney U test
- Wilcoxon signed-rank test
- Kruskal–Wallis test
Choosing the correct test depends on:
- Data distribution
- Sample size
- Study design
Regression Analysis in Biostatistics Using R
Regression analysis helps model relationships between variables:
- Linear regression
- Logistic regression
- Poisson regression
Applications include:
- Predicting disease risk
- Analyzing dose–response relationships
- Modeling environmental effects
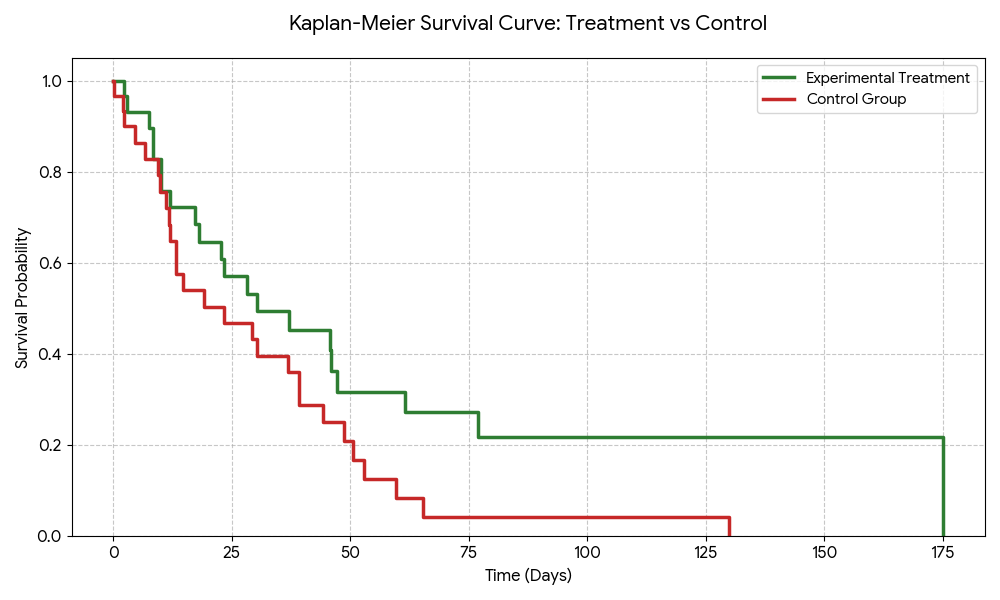
Survival Analysis in R
Survival analysis is essential in medical and clinical research. R provides specialized packages for:
- Kaplan–Meier curves
- Cox proportional hazards model
- Time-to-event analysis
This is commonly used in:
- Cancer research
- Drug trials
- Epidemiology
Multivariate Analysis in Biostatistics
R supports advanced multivariate methods such as:
- Principal Component Analysis (PCA)
- Cluster analysis
- Factor analysis
- Canonical Correspondence Analysis (CCA)
These methods are used in:
- Ecological studies
- Microbiome analysis
- High-dimensional biological data
Reproducible Research with R
One of the biggest advantages of R is reproducibility:
- Scripts document every step
- Results can be regenerated anytime
- Errors can be traced easily
Using tools like R Markdown, researchers can combine:
- Code
- Output
- Text
- Figures
Advantages of Using R in Biostatistics
- Free and open-source
- Publication-quality graphics
- Thousands of biostatistics packages
- Widely accepted in journals
- Strong academic and industry demand
Limitations of R
- Steep learning curve for beginners
- Requires coding knowledge
- Memory limitations for very large datasets
However, with practice, these limitations can be easily managed.
Who Should Learn R Programming for Biostatistics?
- Undergraduate and postgraduate students
- PhD scholars
- Medical researchers
- Epidemiologists
- Environmental scientists
- Data analysts in life sciences
Future Scope of R in Biostatistics
With the rise of:
- Big data
- Bioinformatics
- AI in healthcare
- Precision medicine
R will continue to be a core skill for biostatisticians and biological researchers.
Conclusion
R programming has revolutionized the way biostatistics is performed. Its flexibility, powerful statistical capabilities, and visualization tools make it an indispensable resource for biological and medical research.
By learning R programming in biostatistics, researchers gain the ability to analyze complex datasets, apply appropriate statistical methods, and present results professionally and reproducibly. Whether you are a student or an experienced researcher, mastering R will significantly enhance your research quality and career prospects.
If you work in biological sciences, R is no longer optional—it is essential.